Fig. B.1
Download original image
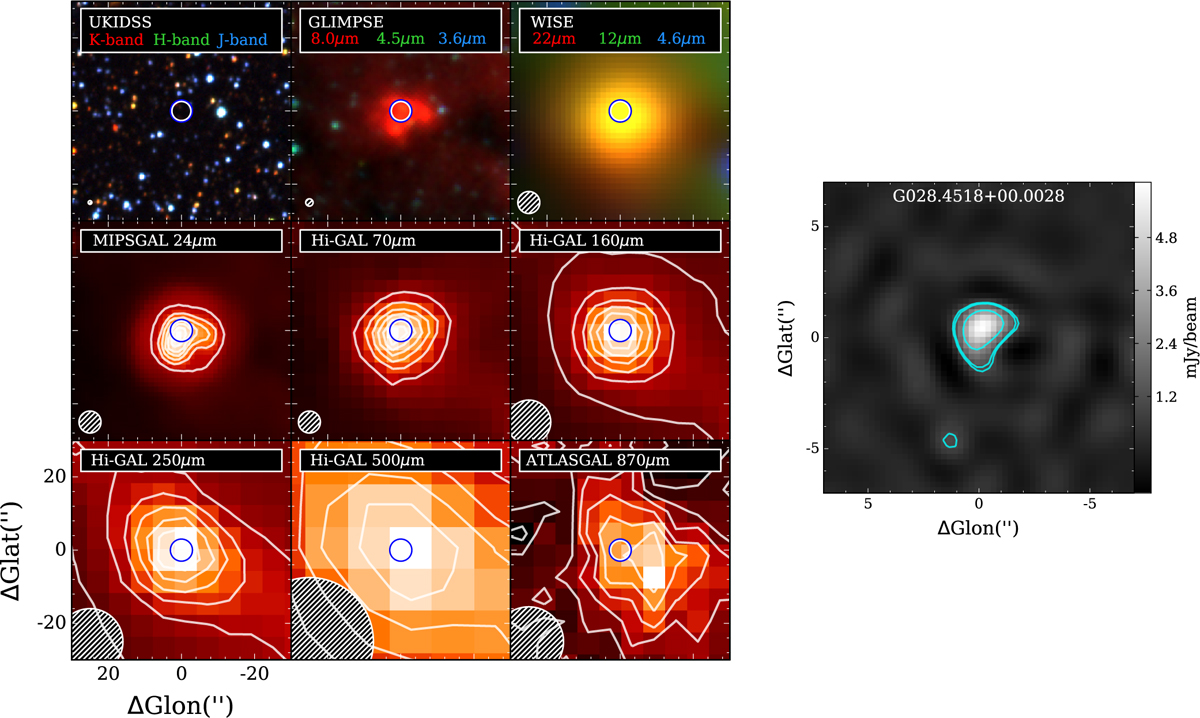
Example of a radio source classified as HII region. Left: Panels from the top left to the bottom right are RGB image of UKIDSS three observed bands, RGB image of GLIMPSE three observed bands, WISE 12 µm, Hi-GAL 70 µm, Hi-GAL 160 µm, Hi-GAL 250 µm, Hi-GAL 500 µm, and ATLASGAL 870 µm. Right: Radio source detected in the GLOSTAR B-configuration image.
Current usage metrics show cumulative count of Article Views (full-text article views including HTML views, PDF and ePub downloads, according to the available data) and Abstracts Views on Vision4Press platform.
Data correspond to usage on the plateform after 2015. The current usage metrics is available 48-96 hours after online publication and is updated daily on week days.
Initial download of the metrics may take a while.