Fig. 9
Download original image
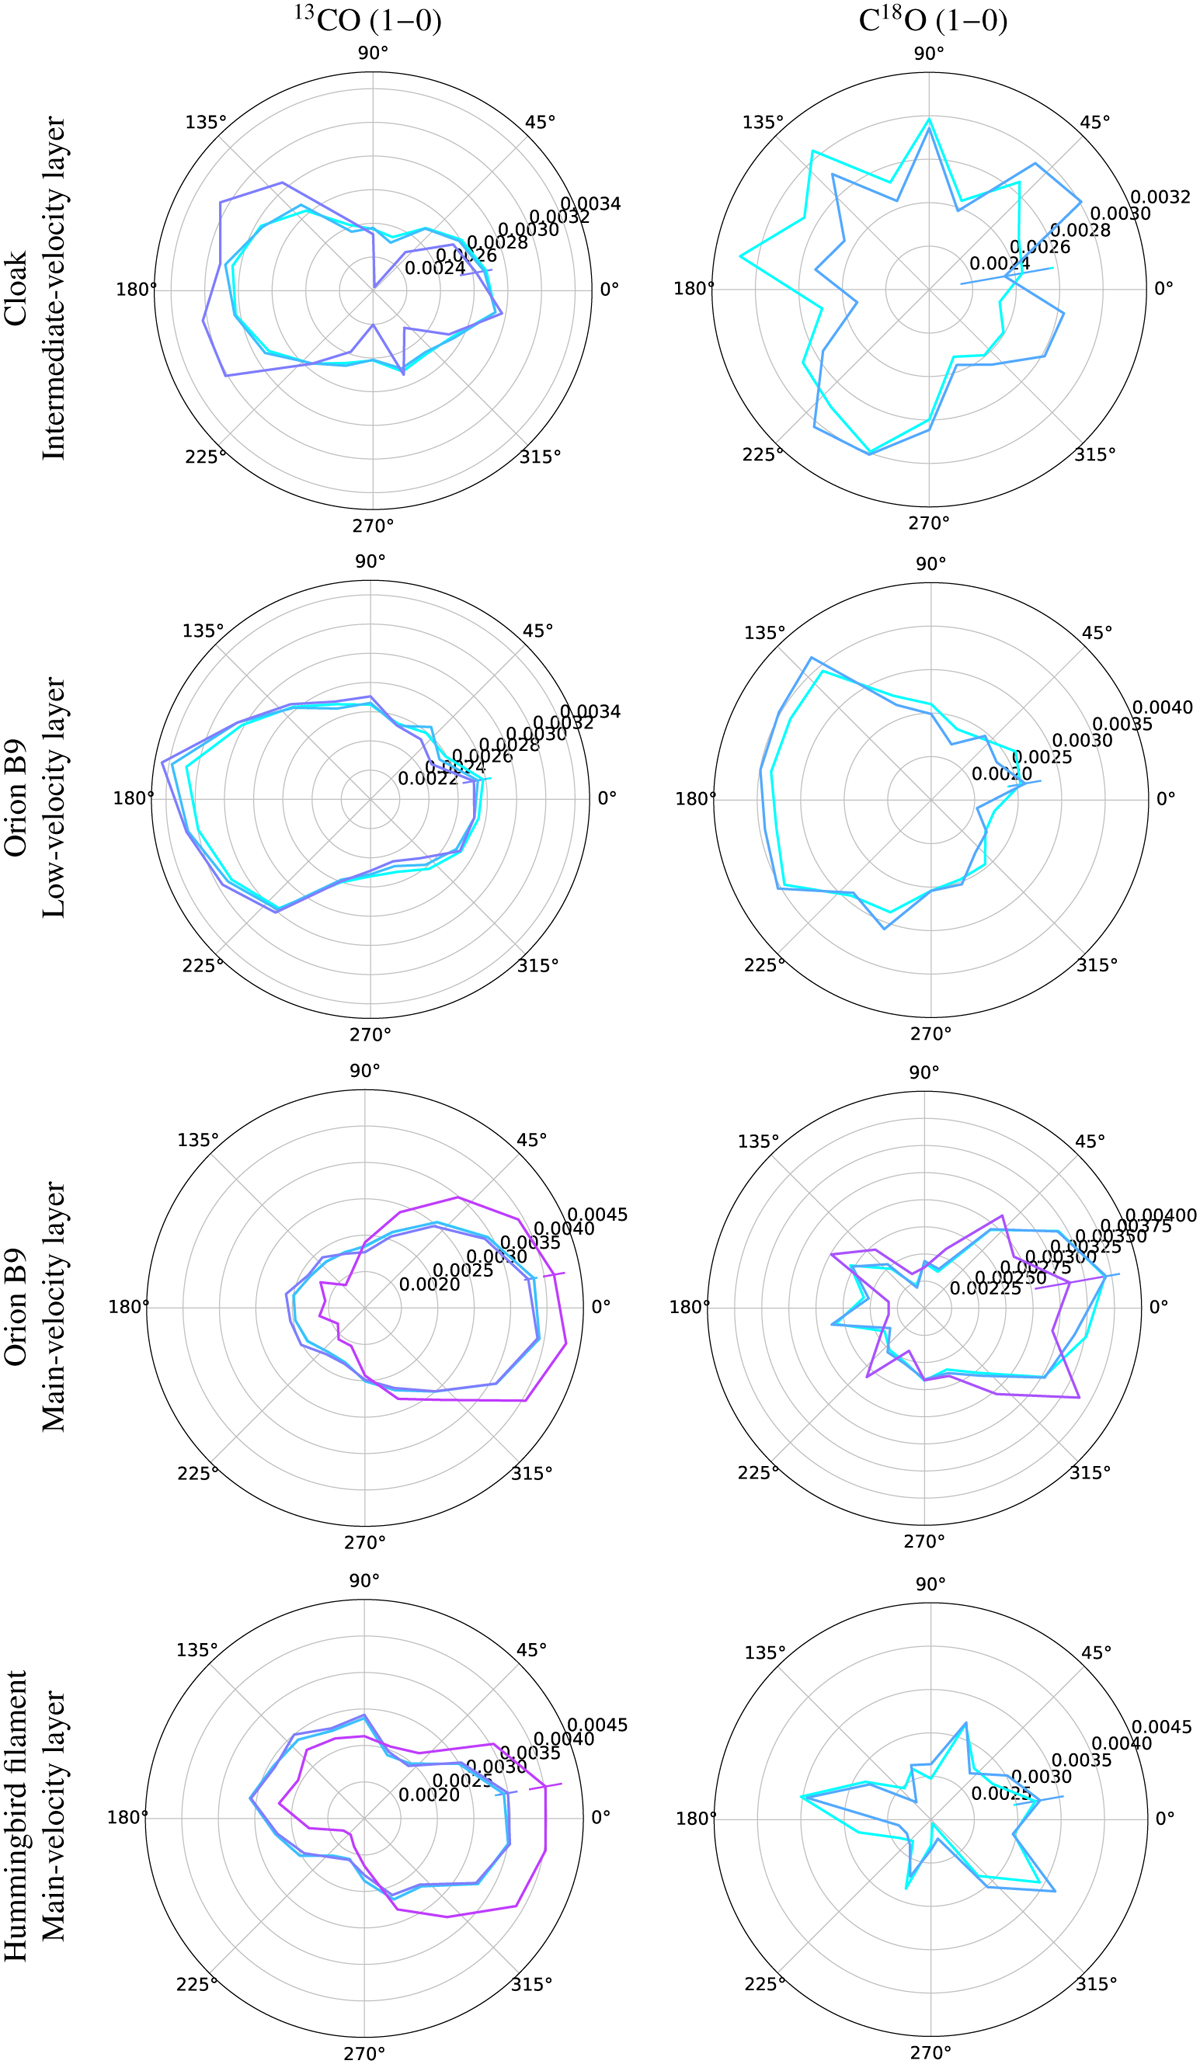
Polar histogram of the relative orientation between the oriented angles of the column density and the velocity gradients from the 13CO (1–0) (left) and the C18O (1–0) (right) emission for the different sub-regions of interest within the Orion B cloud. The different colors correspond to the column density thresholds. For 13CO (1–0): data with ![]() are shown in cyan,
are shown in cyan, ![]() in blue,
in blue, ![]() in blue-violet,
in blue-violet, ![]() in purple, and
in purple, and ![]() in fuchsia. For C18O (1–0): data with
in fuchsia. For C18O (1–0): data with ![]() are shown in cyan,
are shown in cyan, ![]() in blue,
in blue, ![]() in purple, and
in purple, and ![]() in fuchsia. The colored bars at 10° show the error bars of the histograms.
in fuchsia. The colored bars at 10° show the error bars of the histograms.
Current usage metrics show cumulative count of Article Views (full-text article views including HTML views, PDF and ePub downloads, according to the available data) and Abstracts Views on Vision4Press platform.
Data correspond to usage on the plateform after 2015. The current usage metrics is available 48-96 hours after online publication and is updated daily on week days.
Initial download of the metrics may take a while.