Fig. 8
Download original image
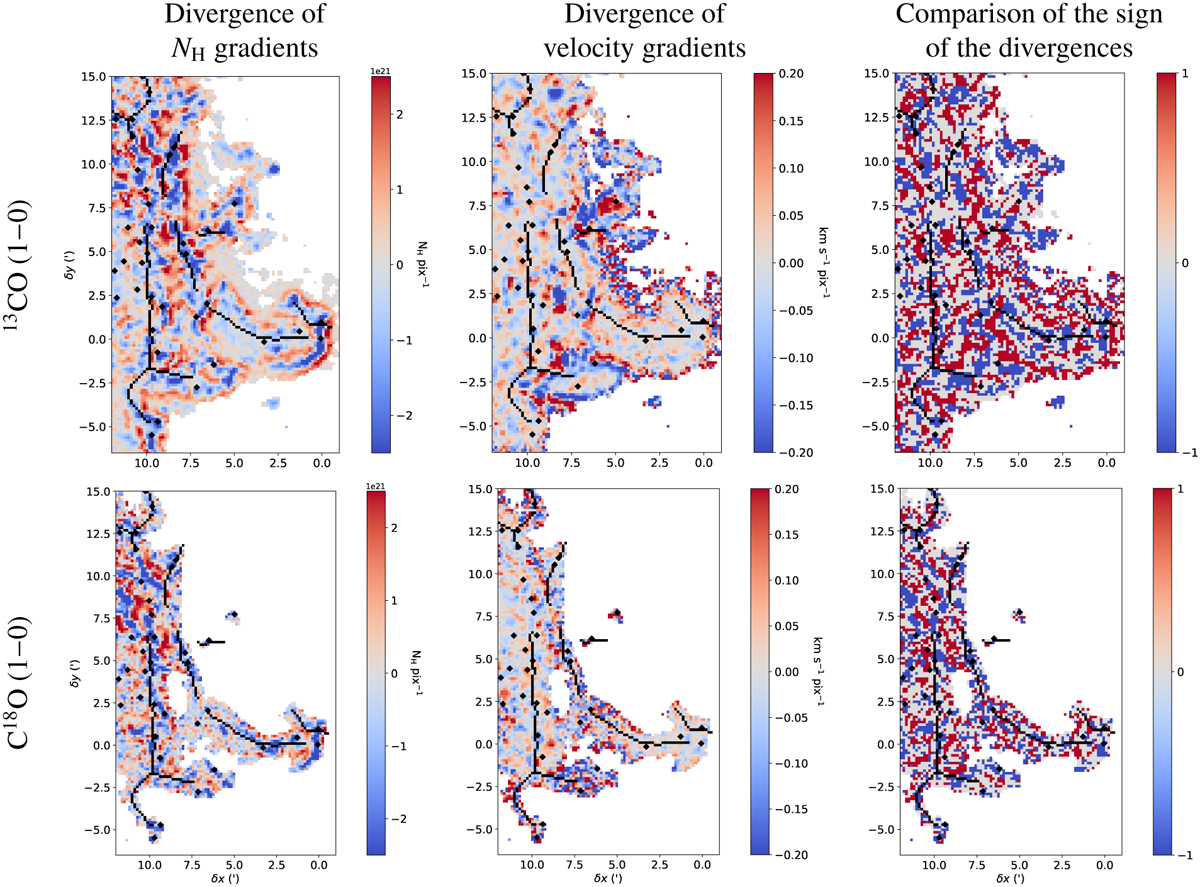
Divergence maps of the column density gradients in NH pix−1 (left) and the velocity gradients in km s−1 pix−1 (middle) in the Horsehead nebula from the main-velocity layer from the 13CO (1–0) (top) and the C18O (1–0) (bottom) emission. Right: comparison maps of the sign between the velocity gradient divergence and the column density gradient divergence. The values –1 (blue) or 1 (red) show the pixels where velocity and column density gradients both converge or both diverge. The value 0 (gray) indicates regions where the sign of at least one gradient is ill-defined because its modulus is close to zero. The black lines show the filamentary structure and the diamond dots show the dense cores identified by the Herschel Gould Belt Survey (Könyves et al. 2020).
Current usage metrics show cumulative count of Article Views (full-text article views including HTML views, PDF and ePub downloads, according to the available data) and Abstracts Views on Vision4Press platform.
Data correspond to usage on the plateform after 2015. The current usage metrics is available 48-96 hours after online publication and is updated daily on week days.
Initial download of the metrics may take a while.