Fig. 6
Download original image
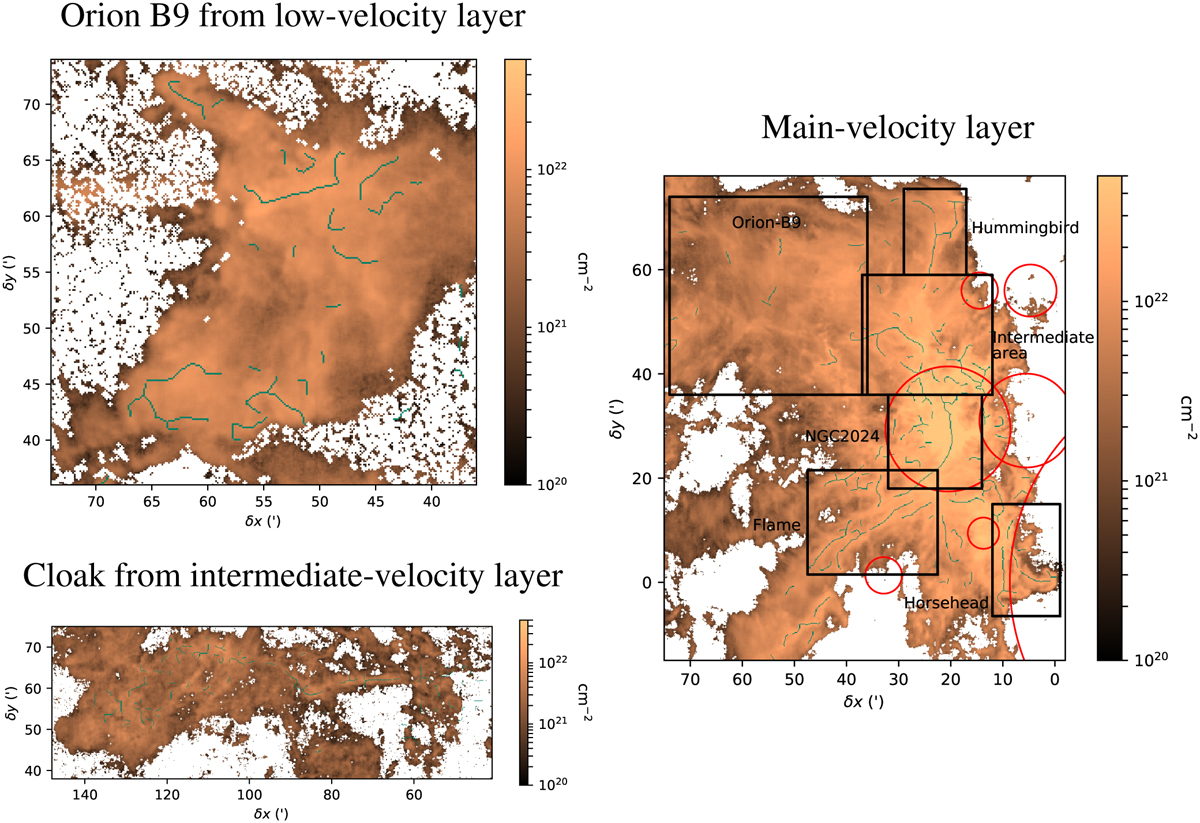
Subregions of interest overlaid on the ![]() maps of each of the identified layer of the Orion B cloud, namely the low-velocity layer (top left), the intermediate-velocity layer (bottom left), and the main-velocity layer (right), from the 13CO (1–0) emission reconstructed by ROHSA. The green lines show the filamentary structures extracted from the C18O (1–0) emission. The red circles show the typical extensions of the Η II regions associated to massive stars (see Table 2).
maps of each of the identified layer of the Orion B cloud, namely the low-velocity layer (top left), the intermediate-velocity layer (bottom left), and the main-velocity layer (right), from the 13CO (1–0) emission reconstructed by ROHSA. The green lines show the filamentary structures extracted from the C18O (1–0) emission. The red circles show the typical extensions of the Η II regions associated to massive stars (see Table 2).
Current usage metrics show cumulative count of Article Views (full-text article views including HTML views, PDF and ePub downloads, according to the available data) and Abstracts Views on Vision4Press platform.
Data correspond to usage on the plateform after 2015. The current usage metrics is available 48-96 hours after online publication and is updated daily on week days.
Initial download of the metrics may take a while.