Fig. 2
Download original image
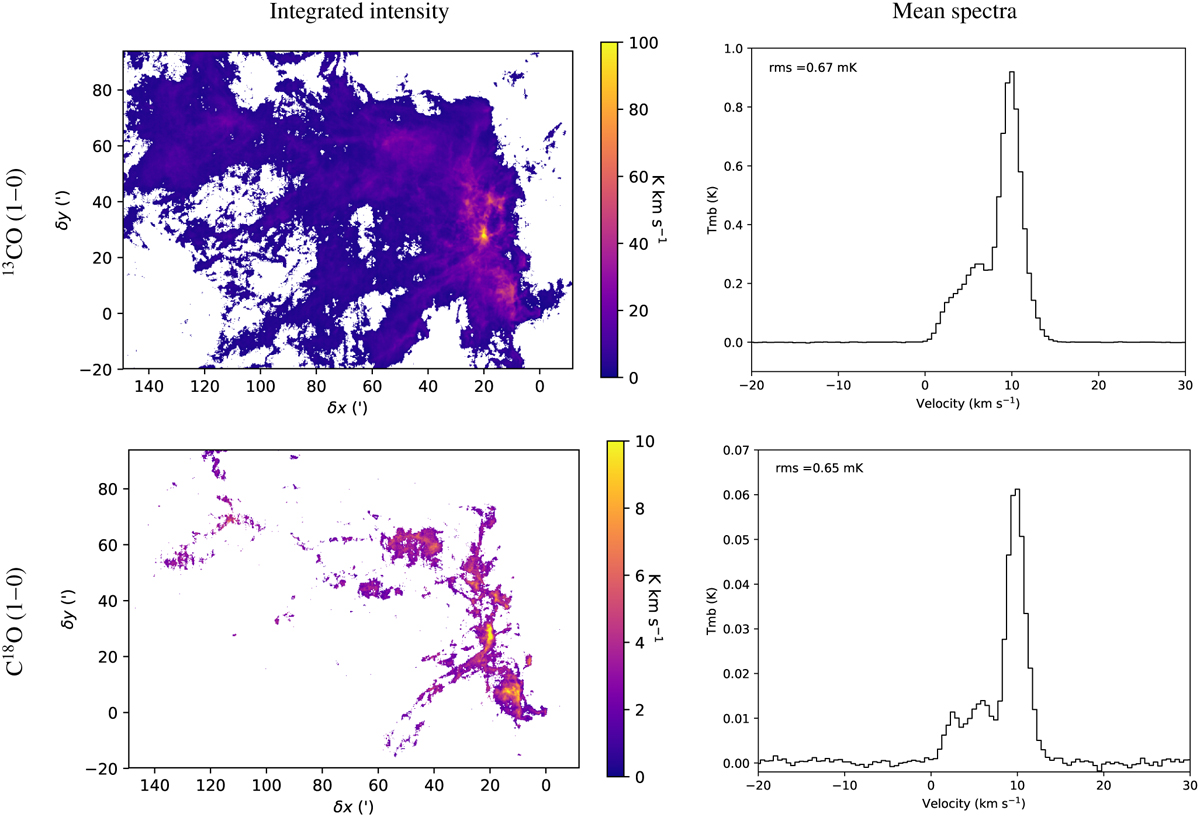
Zero-order moment maps (integrated intensity) of the total emission of the Orion B cloud (left) and mean spectra (right) of the 13CO (1–0) (top) and C18O (1–0) (bottom) molecular lines from the 30 m data sets. For the zero-order moment map, the integration was done on a velocity range between –5 and 20 km s–1. Isolated pixels and pixels with a signal-to-noise ratio lower than 3 are blanked.
Current usage metrics show cumulative count of Article Views (full-text article views including HTML views, PDF and ePub downloads, according to the available data) and Abstracts Views on Vision4Press platform.
Data correspond to usage on the plateform after 2015. The current usage metrics is available 48-96 hours after online publication and is updated daily on week days.
Initial download of the metrics may take a while.