Open Access
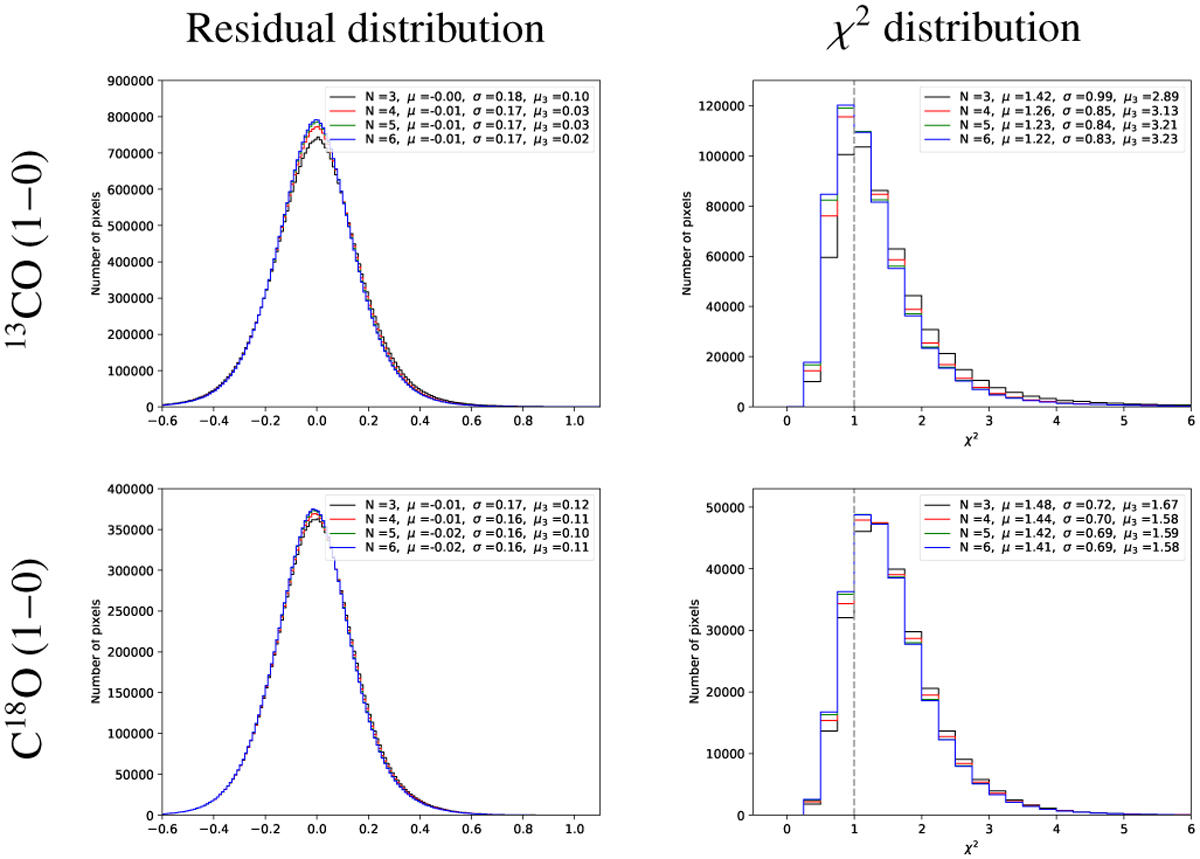
Fig. A.1
Download original image
Residual (left) χ2 (right) distributions between the original and the ROHSA reconstructed cubes for different numbers N of Gaussian components and λi = 100 from the 13CO (1–0) (top) and C18O (1–0) (bottom) emission, respectively. The mean, variance and skewness of each distribution are shown in legend.
Current usage metrics show cumulative count of Article Views (full-text article views including HTML views, PDF and ePub downloads, according to the available data) and Abstracts Views on Vision4Press platform.
Data correspond to usage on the plateform after 2015. The current usage metrics is available 48-96 hours after online publication and is updated daily on week days.
Initial download of the metrics may take a while.