Fig. 10
Download original image
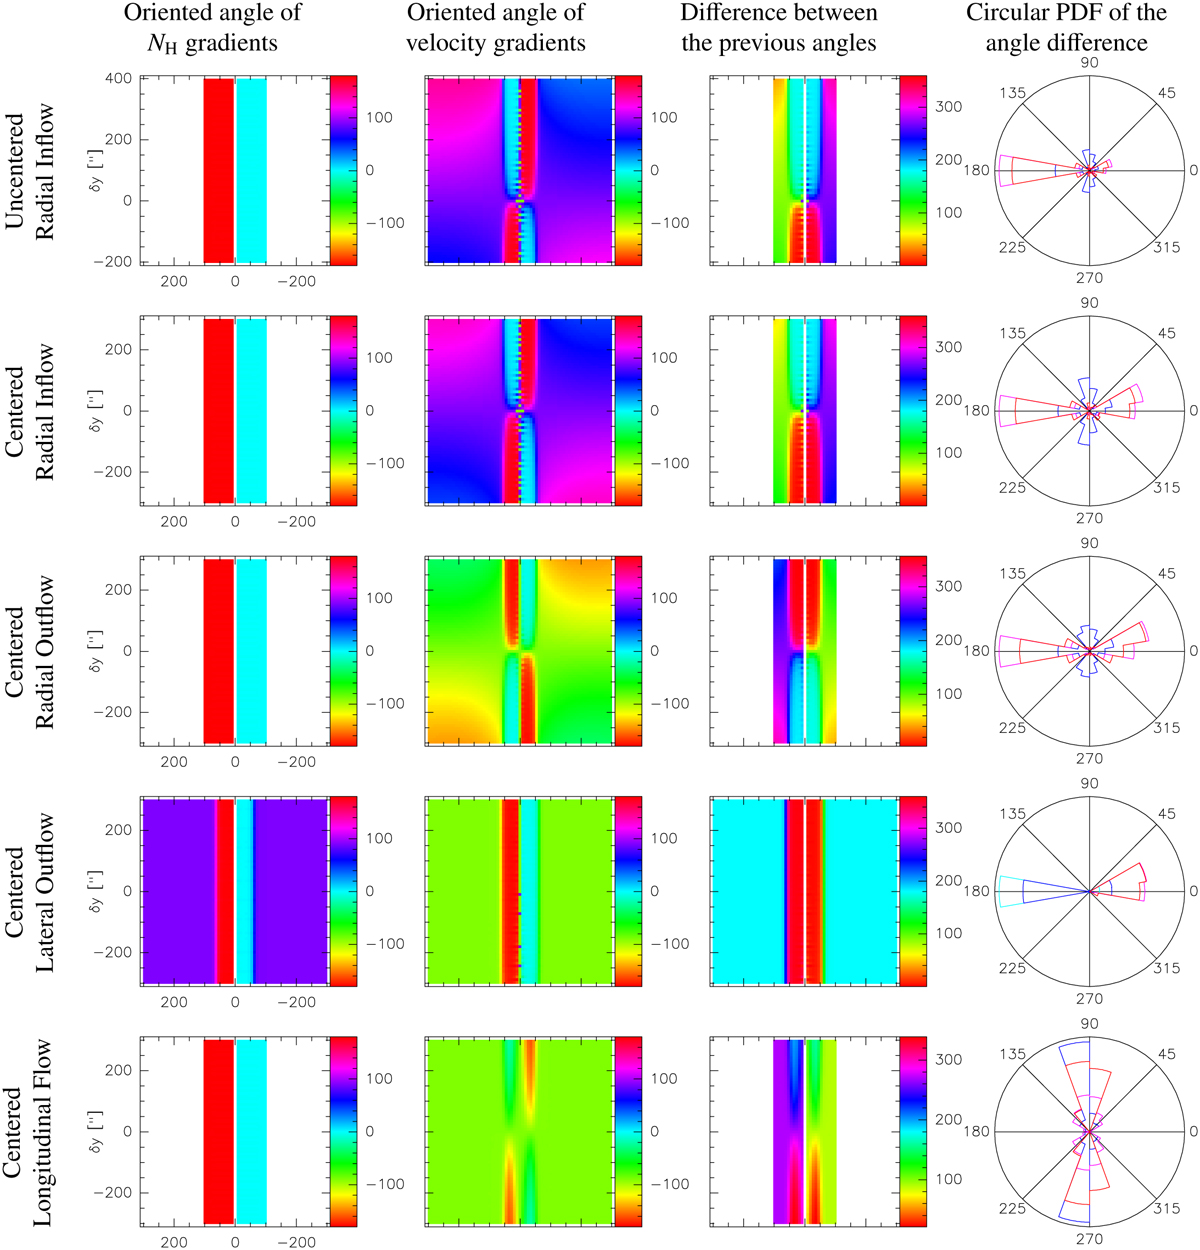
Oriented angles of the gradient of column density and centroid velocity, and their differences for five different toy models of the density and velocity fields. All angles are displayed in degree. The white areas on the images show regions where the gradient is too small to reliably compute its orientation. The different colors of the circular probability distribution function (PDF) correspond to the column density thresholds which are used in the Orion B data set analysis: log(NH) > 21.00 cm−2 are shown in cyan, log(NH) > 21.55 cm−2 in blue, log(NH) > 22.00 cm−2 in pink, and log(NH) > 22.40 cm−2 in red.
Current usage metrics show cumulative count of Article Views (full-text article views including HTML views, PDF and ePub downloads, according to the available data) and Abstracts Views on Vision4Press platform.
Data correspond to usage on the plateform after 2015. The current usage metrics is available 48-96 hours after online publication and is updated daily on week days.
Initial download of the metrics may take a while.