Open Access
Fig. 9
Download original image
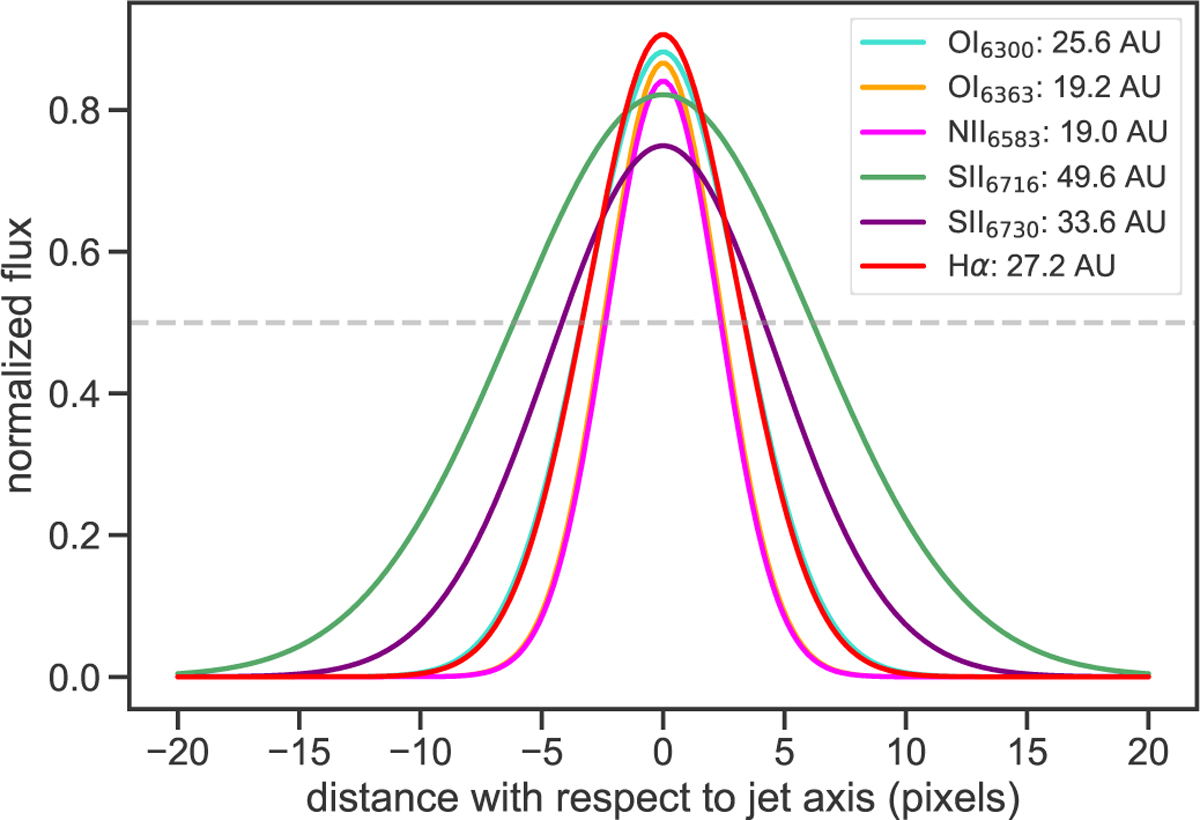
Line-width profile of the emission lines analyzed in DL Tau. Each line profile is the result of a compilation of the Gaussian fits to intensity slices across the outflow/jet and their maximum intensity peaks are centered at the jet axis. The width of the outflow/jet, in au, is shown in the legend box.
Current usage metrics show cumulative count of Article Views (full-text article views including HTML views, PDF and ePub downloads, according to the available data) and Abstracts Views on Vision4Press platform.
Data correspond to usage on the plateform after 2015. The current usage metrics is available 48-96 hours after online publication and is updated daily on week days.
Initial download of the metrics may take a while.