Fig. 2

Download original image
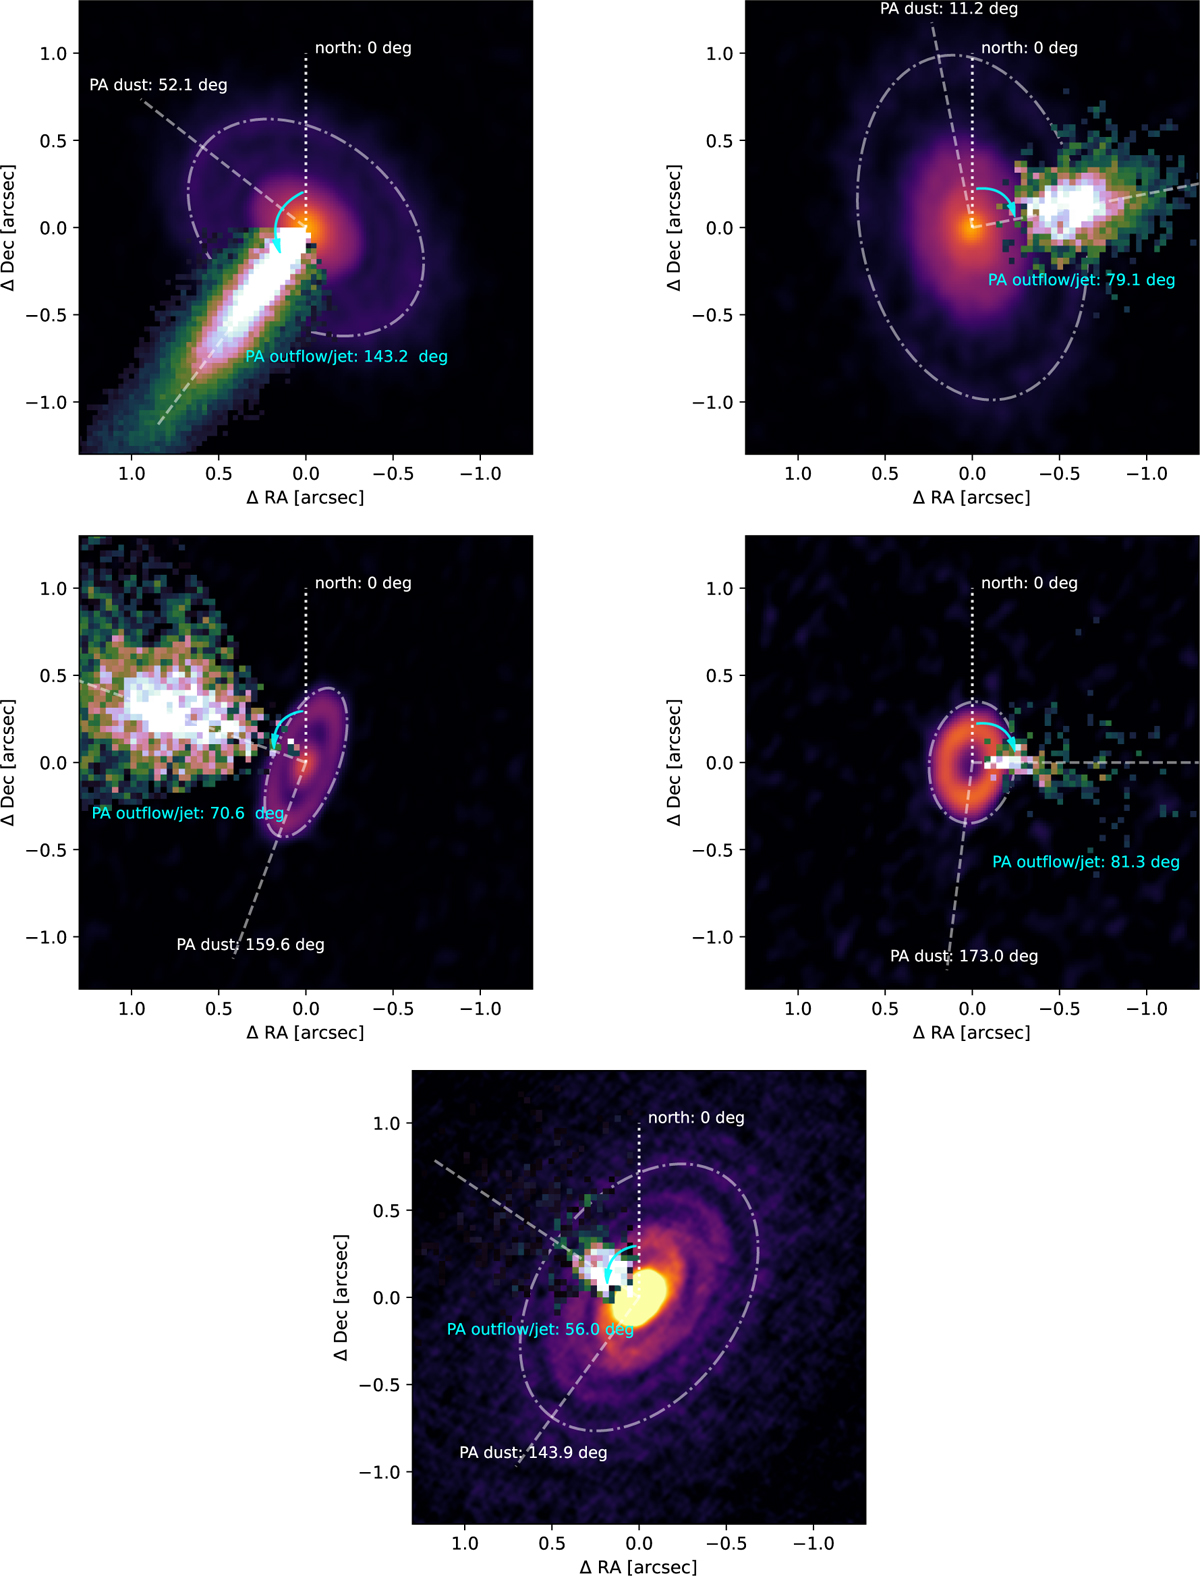
Visualization of the estimated ![]() compared to the PAdust. Top panels show DL Tau (left) and CI Tau (right). Middle panels show DS Tau (left) and IP Tau (right). Bottom panel is IM Lup. The MUSE outflow/jet images are averaged from the different emission lines that are used to estimate the
compared to the PAdust. Top panels show DL Tau (left) and CI Tau (right). Middle panels show DS Tau (left) and IP Tau (right). Bottom panel is IM Lup. The MUSE outflow/jet images are averaged from the different emission lines that are used to estimate the ![]() . We adopt the geometrical configuration visually demonstrated in Fig. 3 from Piétu et al. (2007) for the disks with positive and negative inclination. CI Tau has positive disk inclination, and the
. We adopt the geometrical configuration visually demonstrated in Fig. 3 from Piétu et al. (2007) for the disks with positive and negative inclination. CI Tau has positive disk inclination, and the ![]() is measured from north to west. The rest of the sources have negative disk inclination and the
is measured from north to west. The rest of the sources have negative disk inclination and the ![]() is measured from north to east.
is measured from north to east.
Current usage metrics show cumulative count of Article Views (full-text article views including HTML views, PDF and ePub downloads, according to the available data) and Abstracts Views on Vision4Press platform.
Data correspond to usage on the plateform after 2015. The current usage metrics is available 48-96 hours after online publication and is updated daily on week days.
Initial download of the metrics may take a while.


