Open Access
Fig. A.2
Download original image
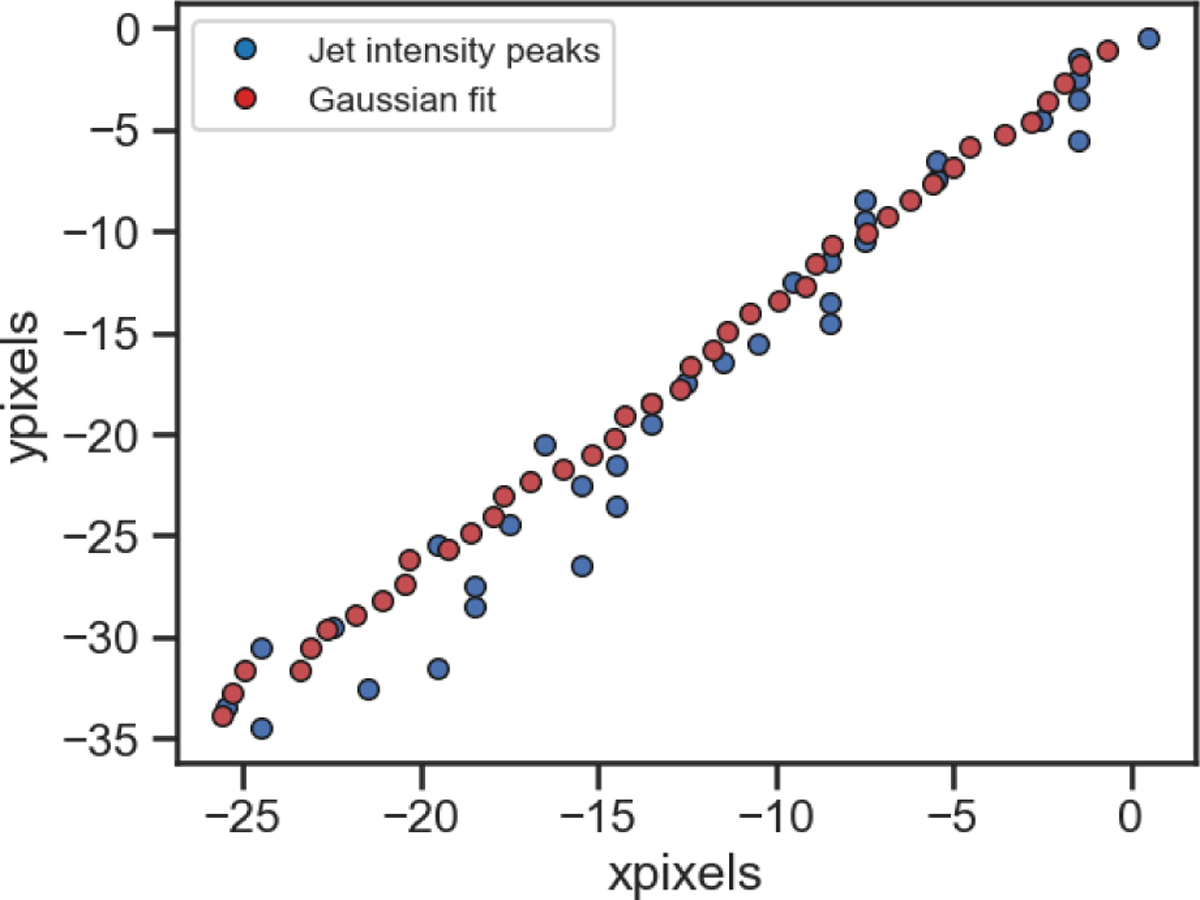
[O I] λ6300 successive outflow/jet intensity peaks across the jet axis in blue. We overplot the Gaussian centers from the fit in red, which is then used to estimate the PAoutflow/jet. The deviations of the outflow/jet intensity peaks could be caused by noise in the data.
Current usage metrics show cumulative count of Article Views (full-text article views including HTML views, PDF and ePub downloads, according to the available data) and Abstracts Views on Vision4Press platform.
Data correspond to usage on the plateform after 2015. The current usage metrics is available 48-96 hours after online publication and is updated daily on week days.
Initial download of the metrics may take a while.