Fig. 1
Download original image
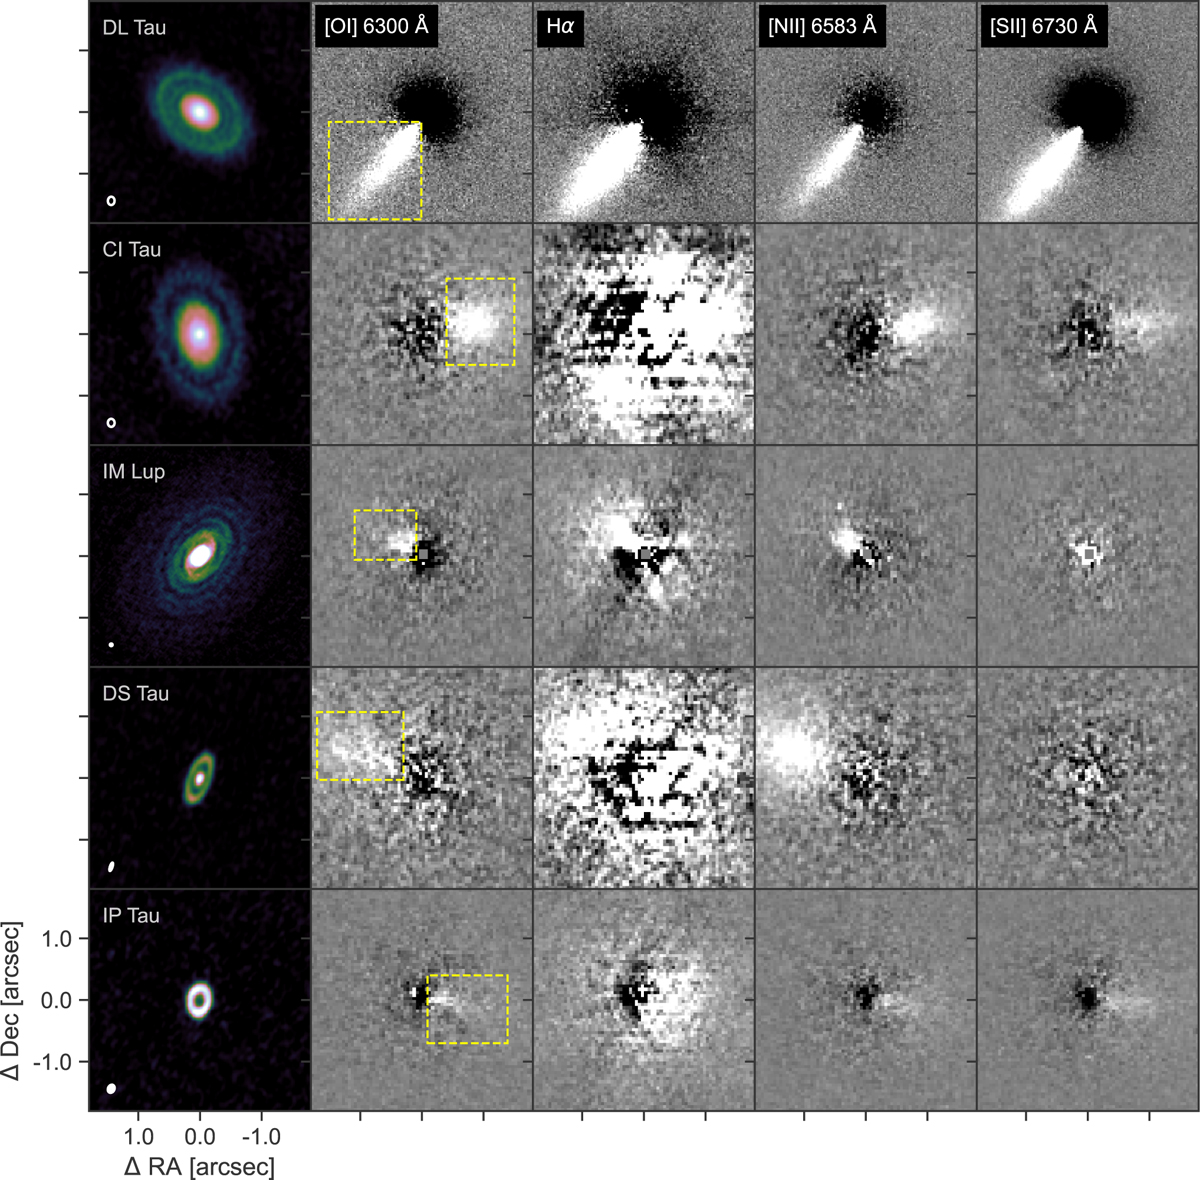
Composite image of different protoplanetary disks at four different forbidden emission lines. First column shows the dust continuum emission at 1.3 mm from ALMA cycle 4 (Long et al. 2018, 2019). Other columns show the different forbidden emission lines from MUSE as labeled in the top left of the first row. Dashed yellow rectangles mark the area from where we gather the spectrum of the jet by summing over the spatial axes within the dashed yellow frame of the image.
Current usage metrics show cumulative count of Article Views (full-text article views including HTML views, PDF and ePub downloads, according to the available data) and Abstracts Views on Vision4Press platform.
Data correspond to usage on the plateform after 2015. The current usage metrics is available 48-96 hours after online publication and is updated daily on week days.
Initial download of the metrics may take a while.