| Issue |
A&A
Volume 670, February 2023
|
|
|---|---|---|
| Article Number | C4 | |
| Number of page(s) | 1 | |
| Section | The Sun and the Heliosphere | |
| DOI | https://doi.org/10.1051/0004-6361/202040161e | |
| Published online | 13 February 2023 | |
Transition to turbulence in nonuniform coronal loops driven by torsional Alfvén waves (Corrigendum)
1
Departament de Física, Universitat de les Illes Balears, Carretera de Valldemossa km 7.5, 07122 Palma de Mallorca, Spain
e-mail: This email address is being protected from spambots. You need JavaScript enabled to view it.
2
Institute of Applied Computing & Community Code (IAC3), Universitat de les Illes Balears, Carretera de Valldemossa km 7.5, 07122 Palma de Mallorca, Spain
Key words: magnetohydrodynamics (MHD) / Sun: atmosphere / waves / Sun: oscillations / methods: numerical / errata, addenda
Unfortunately, two small corrections need to be made to the published version of the paper. First of all, the value of the plasma β given at the end of Sect. 2.1 should actually be 0.048, that is, a factor of 2 larger than the value given in the text. This, however, does not change the fact that the simulations were performed in a low-β regime.
Secondly, following Mann et al. (1995), the effective wave number across the loop can be estimated by
 (1)
(1)
where ωA(r) is the Alfvén frequency. Due to a miscalculation, a factor of π/L, corresponding to the longitudinal wave number, was not included in the computation of the derivative of the Alfvén frequency. As a consequence of that, the effective wave number was overestimated. This correction is now considered in Fig. 1, which replaces Fig. 15 of the published paper.
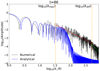 |
Fig. 1. Amplitude spectrum (arbitrary units) of the averaged total energy of the perturbations for the thin-layer case at the end of the simulation for both numerical and linear analytic results. The vertical dot-dashed orange lines denote the maximum phase-mixing-generated wave number, kmaxR ≈ 33, obtained from Eq. (1), and an estimated wave number for which numerical diffusion starts to play a role, kdiffR ≈ 500. The red line is a least-squares linear fit for kmax < k⊥ < kdiff in log-log scale whose slope is −1.83 ± 0.01. The green line is the same fit but for k⊥ > kdiff, whose slope is −3.28 ± 0.07. |
As the maximum wave number predicted by phase-mixing across the loop is now smaller, the first vertical orange line is consequently displaced to the left. This slightly modifies the slope of the red line fit from −2.07 ± 0.02 to −1.83 ± 0.01. The main consequence of this correction is that the slope is somewhat less compatible with the −2 slope expected from the theory of weak Alfvénic turbulence (Nazarenko 2011; Schekochihin et al. 2012). However, taking into account the limitations of this calculation, the subsequent discussion provided in the original paper does not need to be modified.
References
- Mann, I. R., Wright, A. N., & Cally, P. S. 1995, J. Geophys. Res., 100, 19441 [Google Scholar]
- Nazarenko, S. 2011, Wave Turbulence, Vol. 825 [CrossRef] [Google Scholar]
- Schekochihin, A. A., Nazarenko, S. V., & Yousef, T. A. 2012, Phys. Rev. E, 85 [Google Scholar]
© The Authors 2023
 Open Access article, published by EDP Sciences, under the terms of the Creative Commons Attribution License (https://creativecommons.org/licenses/by/4.0), which permits unrestricted use, distribution, and reproduction in any medium, provided the original work is properly cited.
This article is published in open access under the Subscribe-to-Open model. This email address is being protected from spambots. You need JavaScript enabled to view it. to support open access publication.
All Figures
|
Fig. 1. Amplitude spectrum (arbitrary units) of the averaged total energy of the perturbations for the thin-layer case at the end of the simulation for both numerical and linear analytic results. The vertical dot-dashed orange lines denote the maximum phase-mixing-generated wave number, kmaxR ≈ 33, obtained from Eq. (1), and an estimated wave number for which numerical diffusion starts to play a role, kdiffR ≈ 500. The red line is a least-squares linear fit for kmax < k⊥ < kdiff in log-log scale whose slope is −1.83 ± 0.01. The green line is the same fit but for k⊥ > kdiff, whose slope is −3.28 ± 0.07. |
| In the text | |
Current usage metrics show cumulative count of Article Views (full-text article views including HTML views, PDF and ePub downloads, according to the available data) and Abstracts Views on Vision4Press platform.
Data correspond to usage on the plateform after 2015. The current usage metrics is available 48-96 hours after online publication and is updated daily on week days.
Initial download of the metrics may take a while.