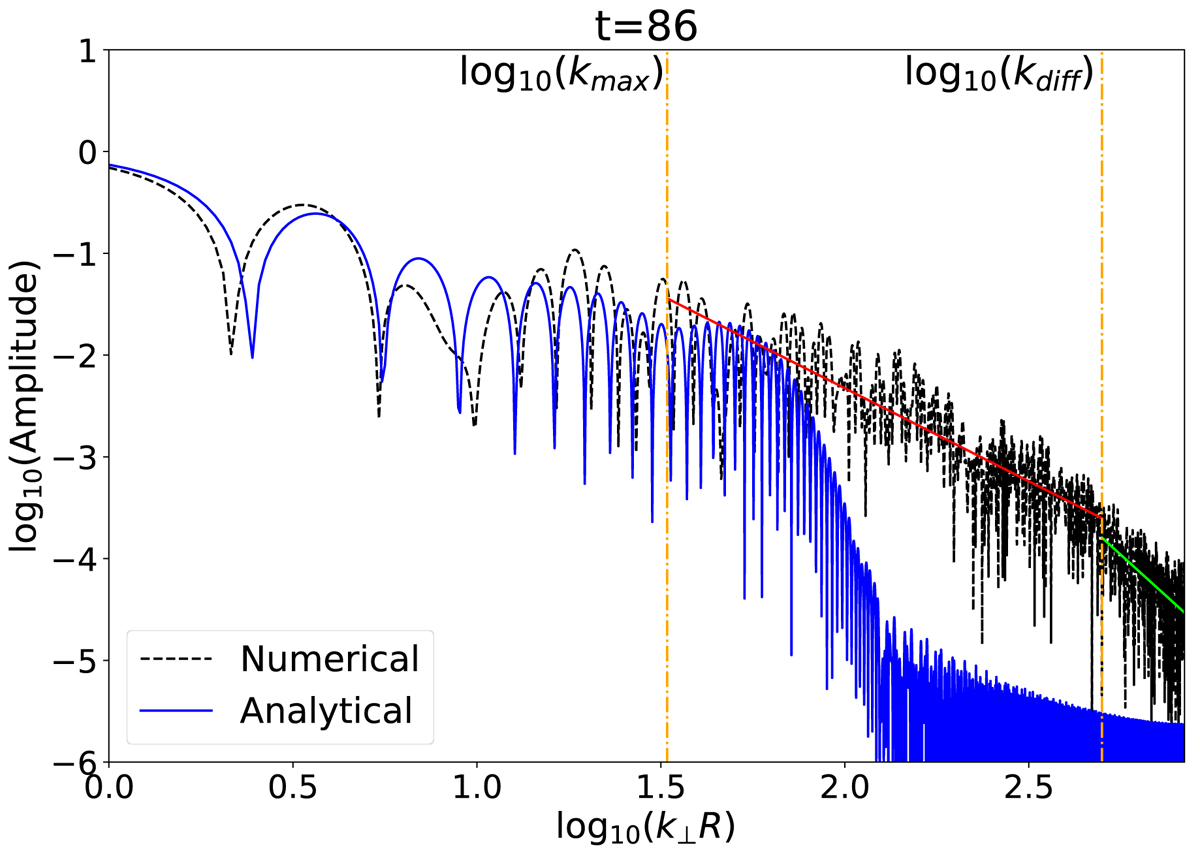
Fig. 1.
Download original image
Amplitude spectrum (arbitrary units) of the averaged total energy of the perturbations for the thin-layer case at the end of the simulation for both numerical and linear analytic results. The vertical dot-dashed orange lines denote the maximum phase-mixing-generated wave number, kmaxR ≈ 33, obtained from Eq. (1), and an estimated wave number for which numerical diffusion starts to play a role, kdiffR ≈ 500. The red line is a least-squares linear fit for kmax < k⊥ < kdiff in log-log scale whose slope is −1.83 ± 0.01. The green line is the same fit but for k⊥ > kdiff, whose slope is −3.28 ± 0.07.
Current usage metrics show cumulative count of Article Views (full-text article views including HTML views, PDF and ePub downloads, according to the available data) and Abstracts Views on Vision4Press platform.
Data correspond to usage on the plateform after 2015. The current usage metrics is available 48-96 hours after online publication and is updated daily on week days.
Initial download of the metrics may take a while.