Open Access
Fig. 2.
Download original image
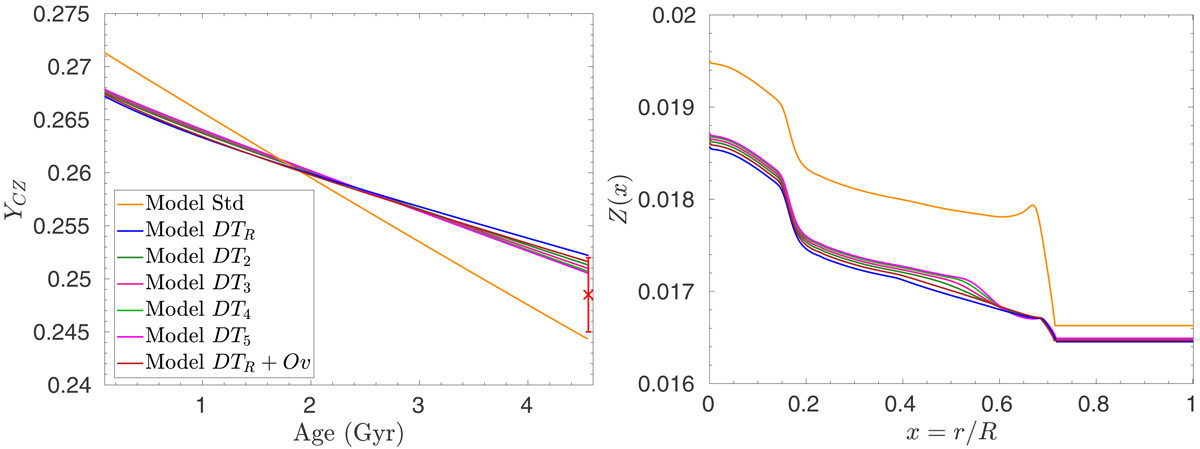
Left panel: evolution of the helium abundance in the convective zone YCZ for the evolutionary models in Table 1. The red cross indicates the seismic value and the 1σ interval from Basu & Antia (1995). Right panel: metallicity profile as a function of normalized radius for the evolutionary models in Table 1.
Current usage metrics show cumulative count of Article Views (full-text article views including HTML views, PDF and ePub downloads, according to the available data) and Abstracts Views on Vision4Press platform.
Data correspond to usage on the plateform after 2015. The current usage metrics is available 48-96 hours after online publication and is updated daily on week days.
Initial download of the metrics may take a while.