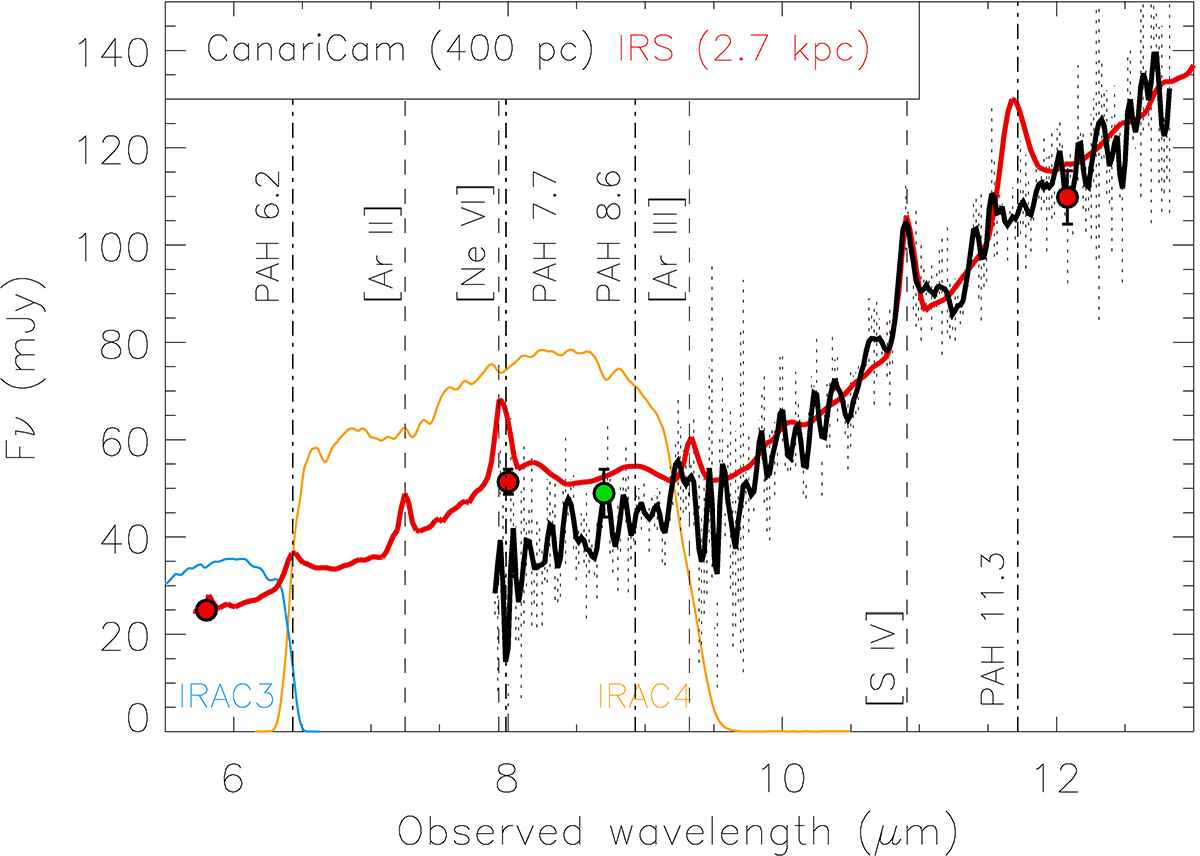
Fig. 2.
Download original image
GTC/CanariCam nuclear spectrum of Mrk 477 (0.5″ ∼ 400 pc; solid black line, with errors indicated as dotted lines). Weak silicate absorption and [S IV]λ10.51 μm emission are the only spectral features detected. The solid red line corresponds to the IRS spectrum (3.6″ ∼ 2.7 kpc), which, in addition to the ionized and warm molecular hydrogen emission lines, shows clear PAH emission bands at 6.2, 7.7, 8.6, and 11.3 μm. Filled dots are the fluxes obtained from images in the CanariCam Si-2 filter (in green), IRAC 5.8 and 8 μm, and WISE 12 μm bands (in red). The transmission curves of the IRAC3 and IRAC4 filters are shown as solid blue and orange lines.
Current usage metrics show cumulative count of Article Views (full-text article views including HTML views, PDF and ePub downloads, according to the available data) and Abstracts Views on Vision4Press platform.
Data correspond to usage on the plateform after 2015. The current usage metrics is available 48-96 hours after online publication and is updated daily on week days.
Initial download of the metrics may take a while.