Open Access
Fig. 7.
Download original image
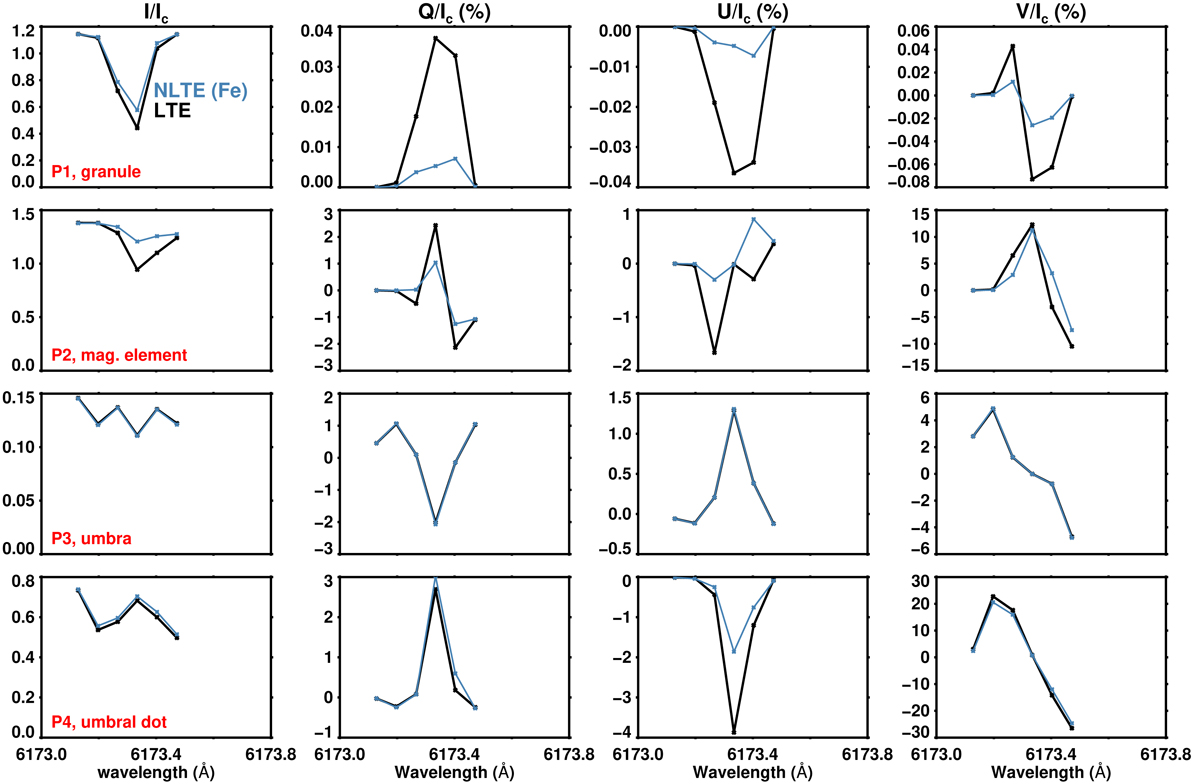
Stokes profiles at the four sample pixels P1, P2, P3, and P4 after degradation onto a coarse wavelength grid with only six spectral points used by the SDO/HMI instrument. These six points are indicated by the vertical lines in Fig. 4. The NLTE profiles used for degradation were computed by treating only Fe in NLTE.
Current usage metrics show cumulative count of Article Views (full-text article views including HTML views, PDF and ePub downloads, according to the available data) and Abstracts Views on Vision4Press platform.
Data correspond to usage on the plateform after 2015. The current usage metrics is available 48-96 hours after online publication and is updated daily on week days.
Initial download of the metrics may take a while.