Fig. 6.
Download original image
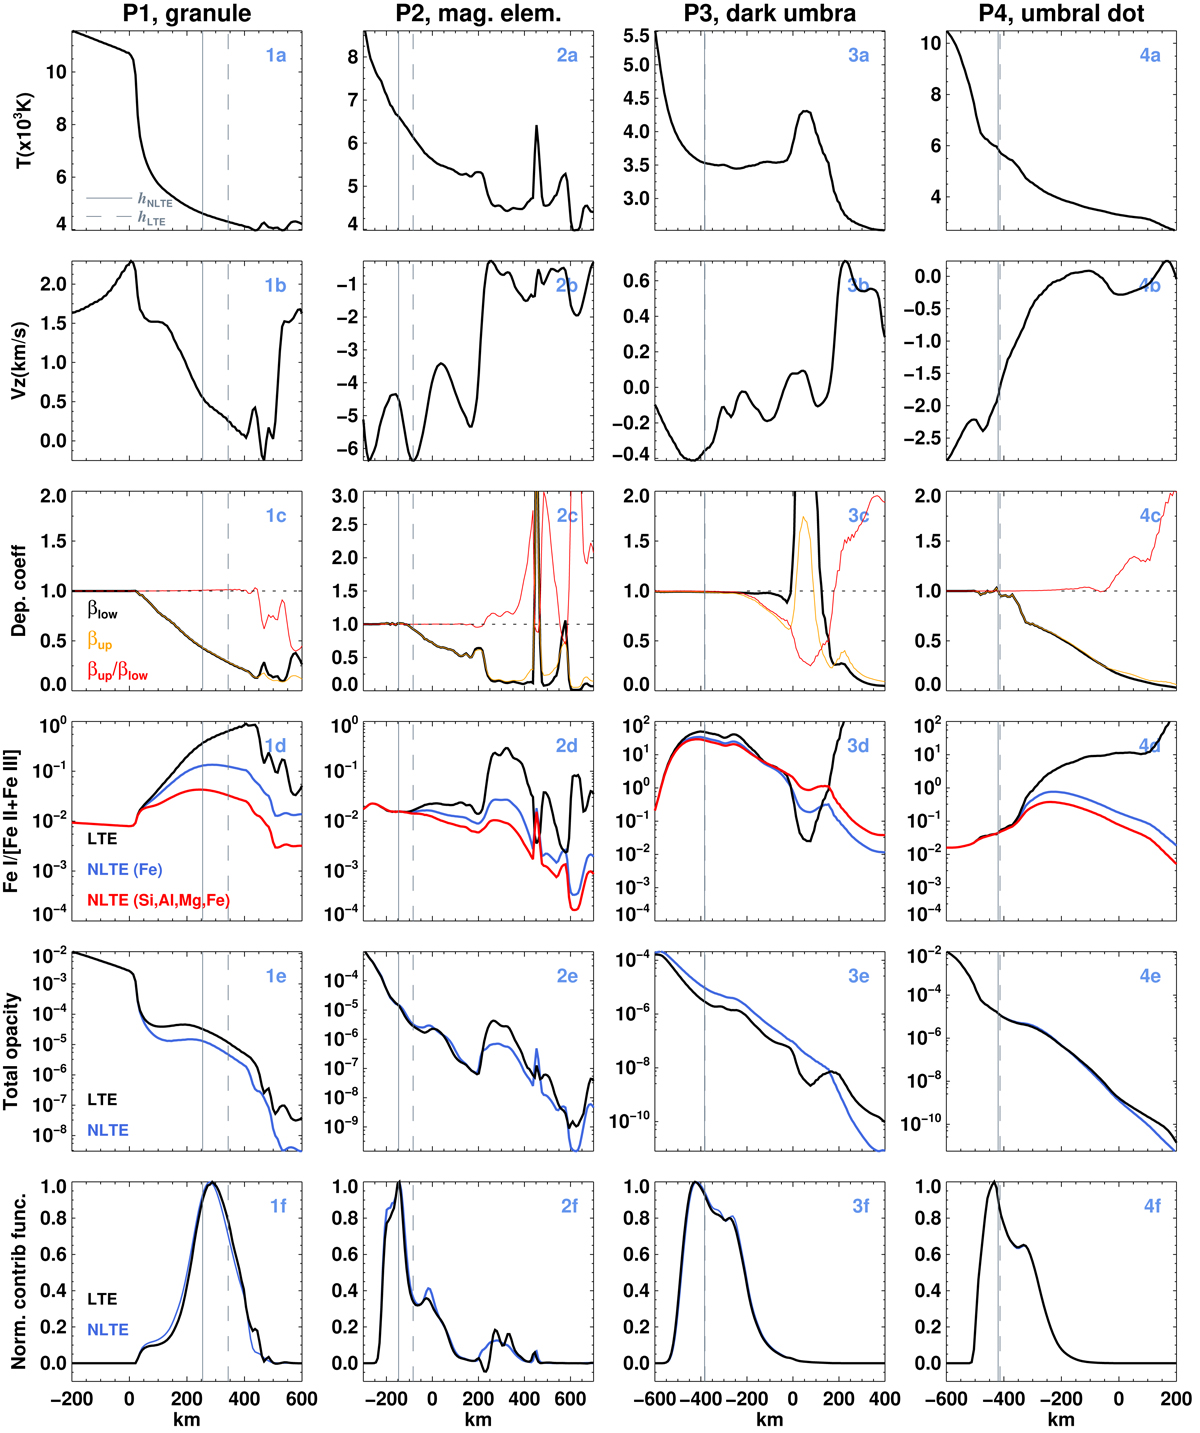
Variation in different physical quantities as a function of height at the four sample pixels. The first two rows show temperature and vertical velocity. The third and fourth rows show the departure coefficients and the ratio of neutral iron atoms to ionized iron atoms (Fe I/[Fe II + Fe III]), respectively, for LTE and NLTE computations for the case where only iron is in NLTE (blue) and where the Si, Al, and Mg are also treated in NLTE (red). The total opacity at the rest wavelength of the line (λ0) is plotted in the fifth row. Finally, the LTE and NLTE normalized contribution functions are shown in the bottom row. The vertical lines indicate the height where τλ0 = 1 when the line is formed in LTE (hLTE, dashed line) and in NLTE (hNLTE, solid line) conditions.
Current usage metrics show cumulative count of Article Views (full-text article views including HTML views, PDF and ePub downloads, according to the available data) and Abstracts Views on Vision4Press platform.
Data correspond to usage on the plateform after 2015. The current usage metrics is available 48-96 hours after online publication and is updated daily on week days.
Initial download of the metrics may take a while.