Fig. 5.
Download original image
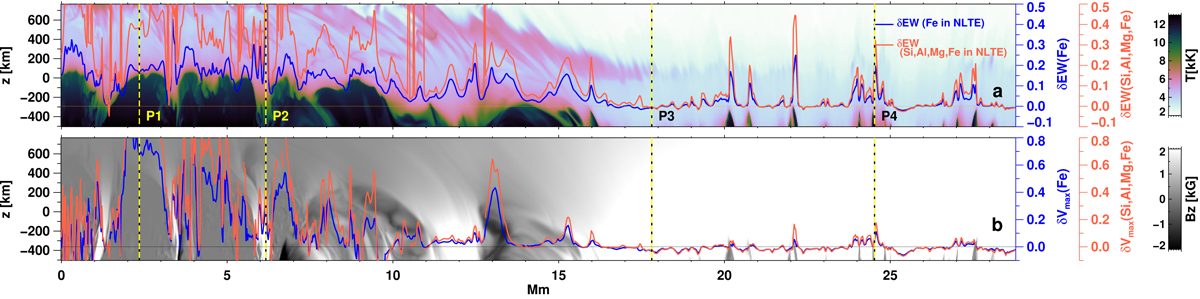
Temperature and line-of-sight magnetic field variation over a slice of the atmosphere from where the four sample pixels were chosen. The pixel positions are given by vertical lines. The variation in δEW (panel a) and δVmax (panel b) across this slice are shown as blue and red curves. The former represents the case where only Fe is in NLTE, while in the latter Si, Al, and Mg are also treated in NLTE (see Sects. 5.3 and 5.4 for more details).
Current usage metrics show cumulative count of Article Views (full-text article views including HTML views, PDF and ePub downloads, according to the available data) and Abstracts Views on Vision4Press platform.
Data correspond to usage on the plateform after 2015. The current usage metrics is available 48-96 hours after online publication and is updated daily on week days.
Initial download of the metrics may take a while.