Fig. 4.
Download original image
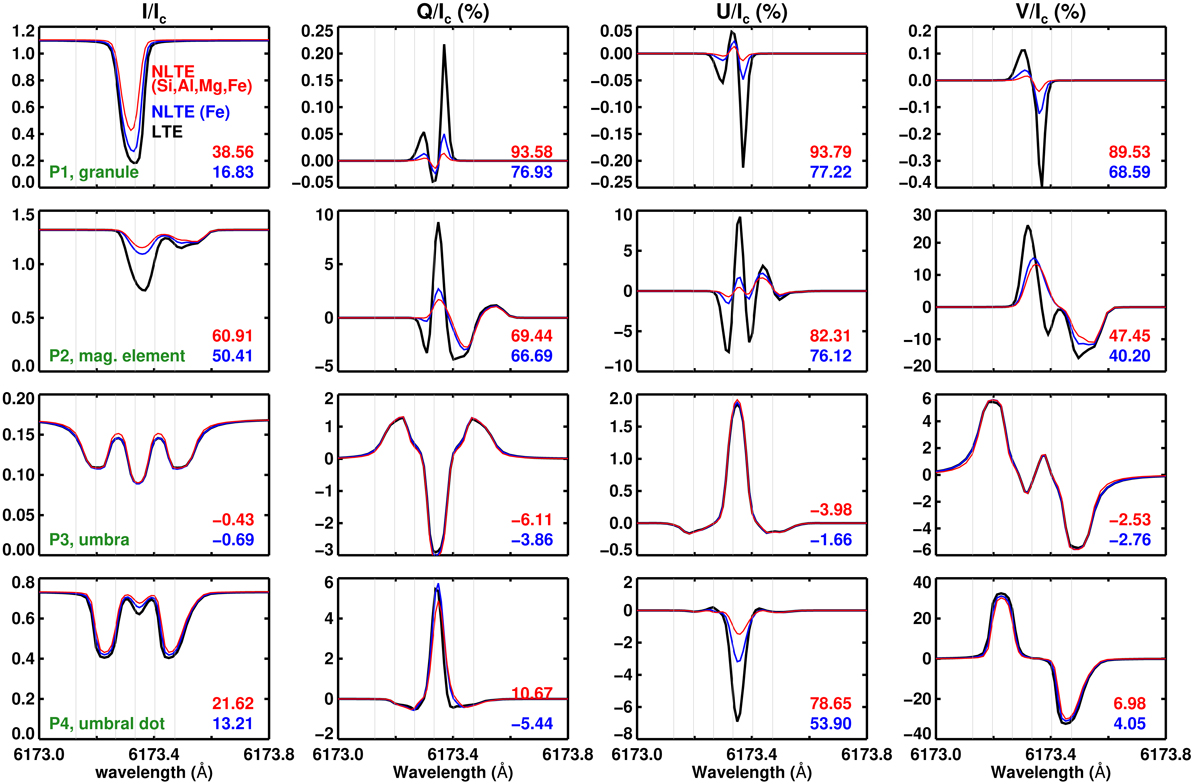
Comparison between the Stokes profiles computed in LTE and NLTE at the four sample pixels P1, P2, P3, and P4 indicated in Fig. 1. The black curves are computed in LTE. The blue curves are computed by treating only iron in NLTE. The red curves are computed by treating Fe as well as Si, Al, and Mg in NLTE. The four columns show Stokes I/Ic, Q/Ic, U/Ic, and V/Ic, expressed as percentages, where Ic is the spatially averaged continuum intensity over the non-spot region of the cube. The six vertical lines give the positions of the grid points sampled by HMI onto which the Stokes profiles are interpolated in Fig. 7. The numbers in the bottom right corner of each panel are the δEW, δQmax, δUmax, and δVmax, respectively, for the profiles in red and blue.
Current usage metrics show cumulative count of Article Views (full-text article views including HTML views, PDF and ePub downloads, according to the available data) and Abstracts Views on Vision4Press platform.
Data correspond to usage on the plateform after 2015. The current usage metrics is available 48-96 hours after online publication and is updated daily on week days.
Initial download of the metrics may take a while.