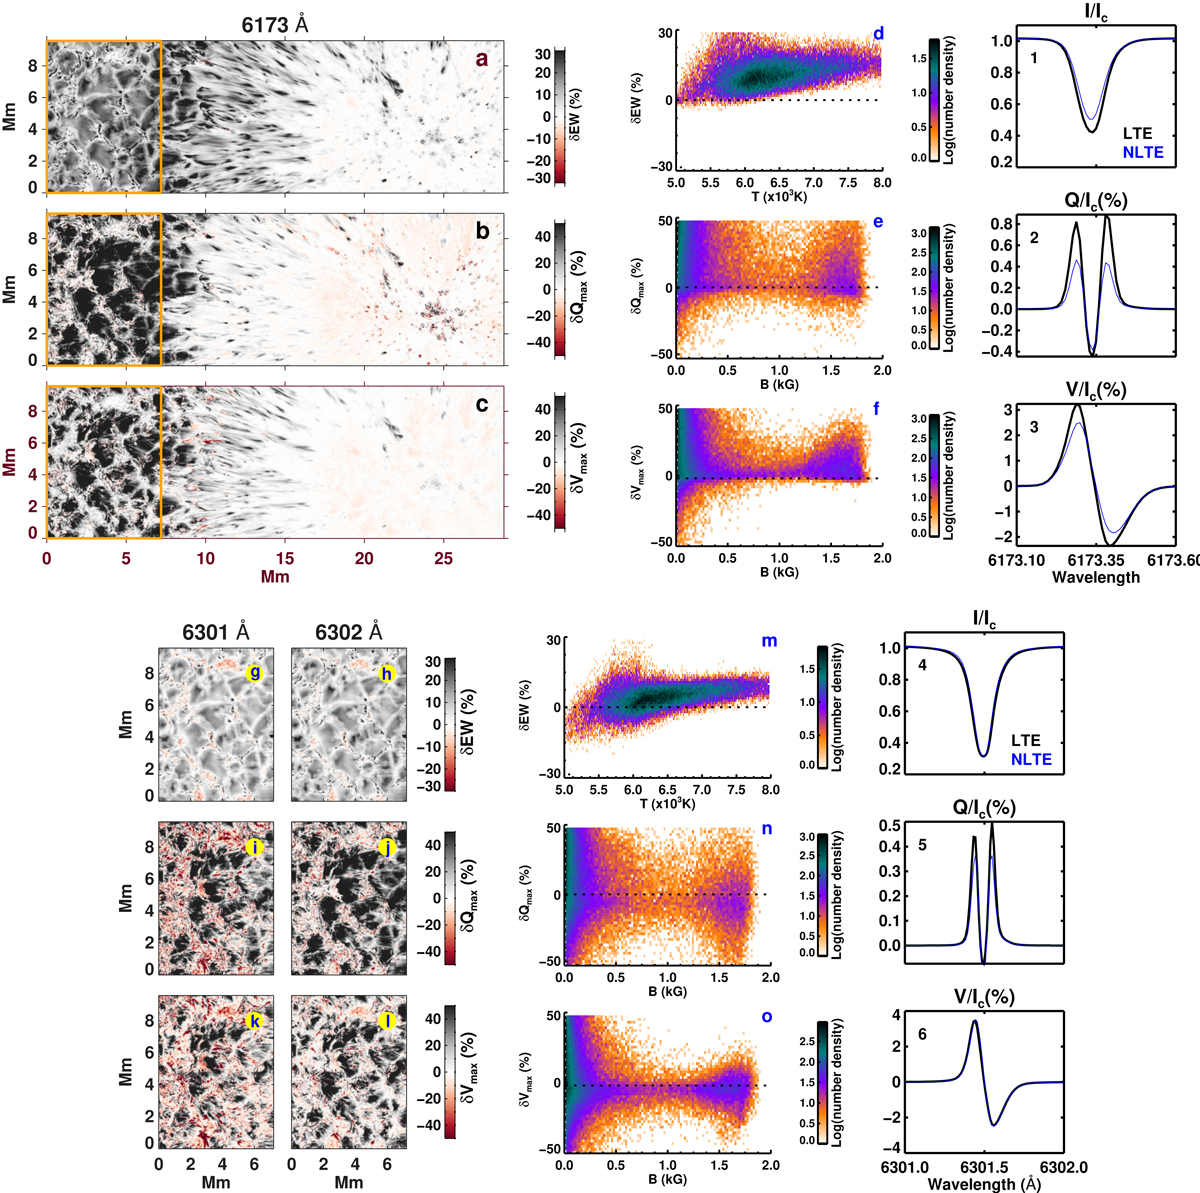
Fig. 3.
Download original image
Comparison between the intensity, linear polarization, and circular polarization profiles computed in LTE and NLTE. Panels a–c show maps of relative differences δEW, δQmax, and δVmax, respectively, for the Fe I 6173 Å line (these quantities are defined in Eq. (2)). Panels g-l show the same for the 6301 Å – 6302 Å line pair, but over a smaller region outside the sunspot indicated by the orange boxes in panels a–c. Panels d–f display scatter plots between various quantities for pixels from within the orange box. They demonstrate the variation in δEW as a function of temperature (T at z = 0 km), and the variation in δQmax and δVmax as a function of the magnetic field strength B at z = 0 km. Panels m–o show similar scatter plots for the 6301 Å line. The stokes profiles of the 6173 Å line spatially averaged over the orange box are plotted in panels 1–3; those of the similarly averaged 6301 Å line are plotted in panels 4–6.
Current usage metrics show cumulative count of Article Views (full-text article views including HTML views, PDF and ePub downloads, according to the available data) and Abstracts Views on Vision4Press platform.
Data correspond to usage on the plateform after 2015. The current usage metrics is available 48-96 hours after online publication and is updated daily on week days.
Initial download of the metrics may take a while.