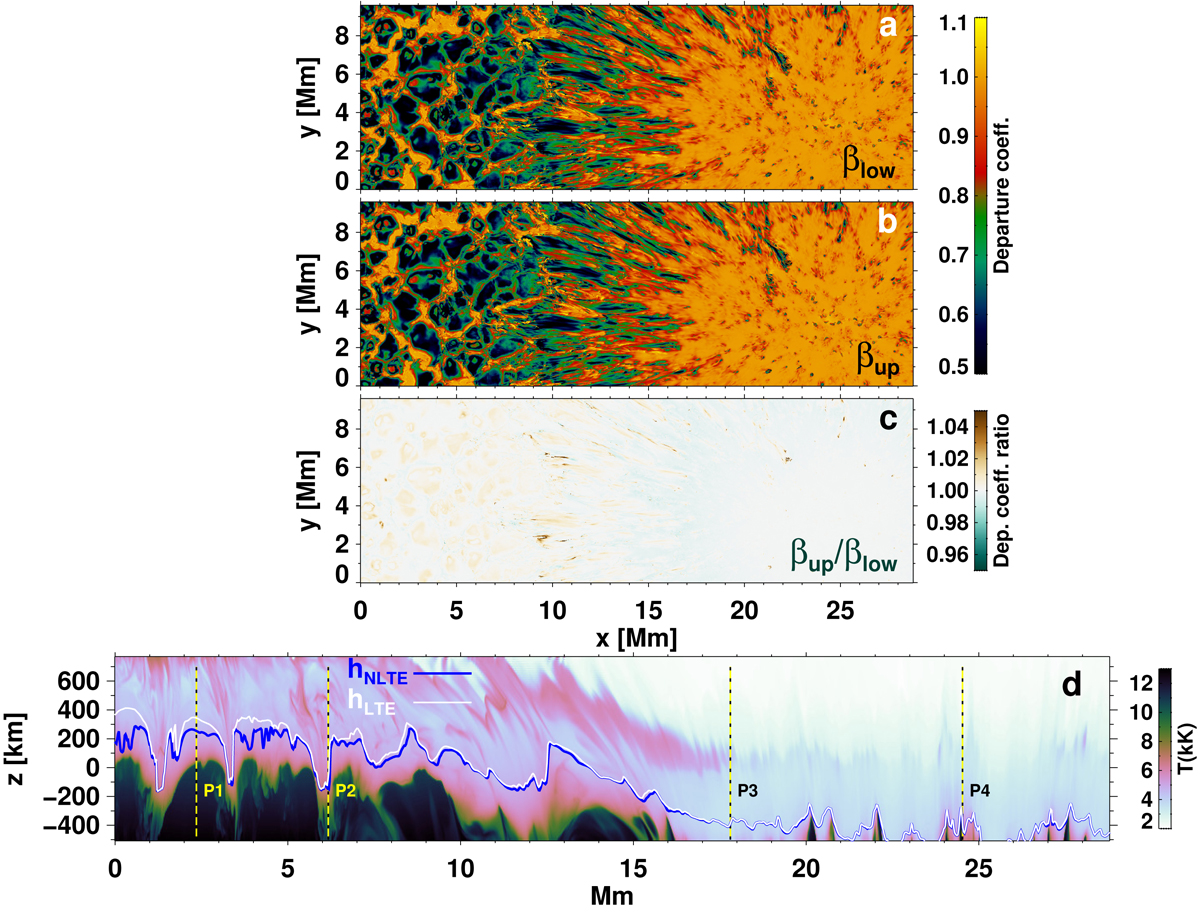
Fig. 2.
Download original image
Maps of departure coefficients at heights where τλ0 = 1, with λ0 being the rest wavelength of the Fe I 6173 Å line. Top panel: departure coefficients of the lower level (βlow). Middle panel: departure coefficient of the upper level (βup). Bottom panel: ratio of βup to βlow. Heights corresponding to τλ0 = 1 surface computed from LTE (white line) and NLTE (blue line) are plotted in panel d. In the background is the temperature map of the slice marked by the horizontal yellow line in Fig. 1. The positions of the four sample pixels chosen for detailed analysis are marked by vertical lines in panel d.
Current usage metrics show cumulative count of Article Views (full-text article views including HTML views, PDF and ePub downloads, according to the available data) and Abstracts Views on Vision4Press platform.
Data correspond to usage on the plateform after 2015. The current usage metrics is available 48-96 hours after online publication and is updated daily on week days.
Initial download of the metrics may take a while.