Fig. 1.
Download original image
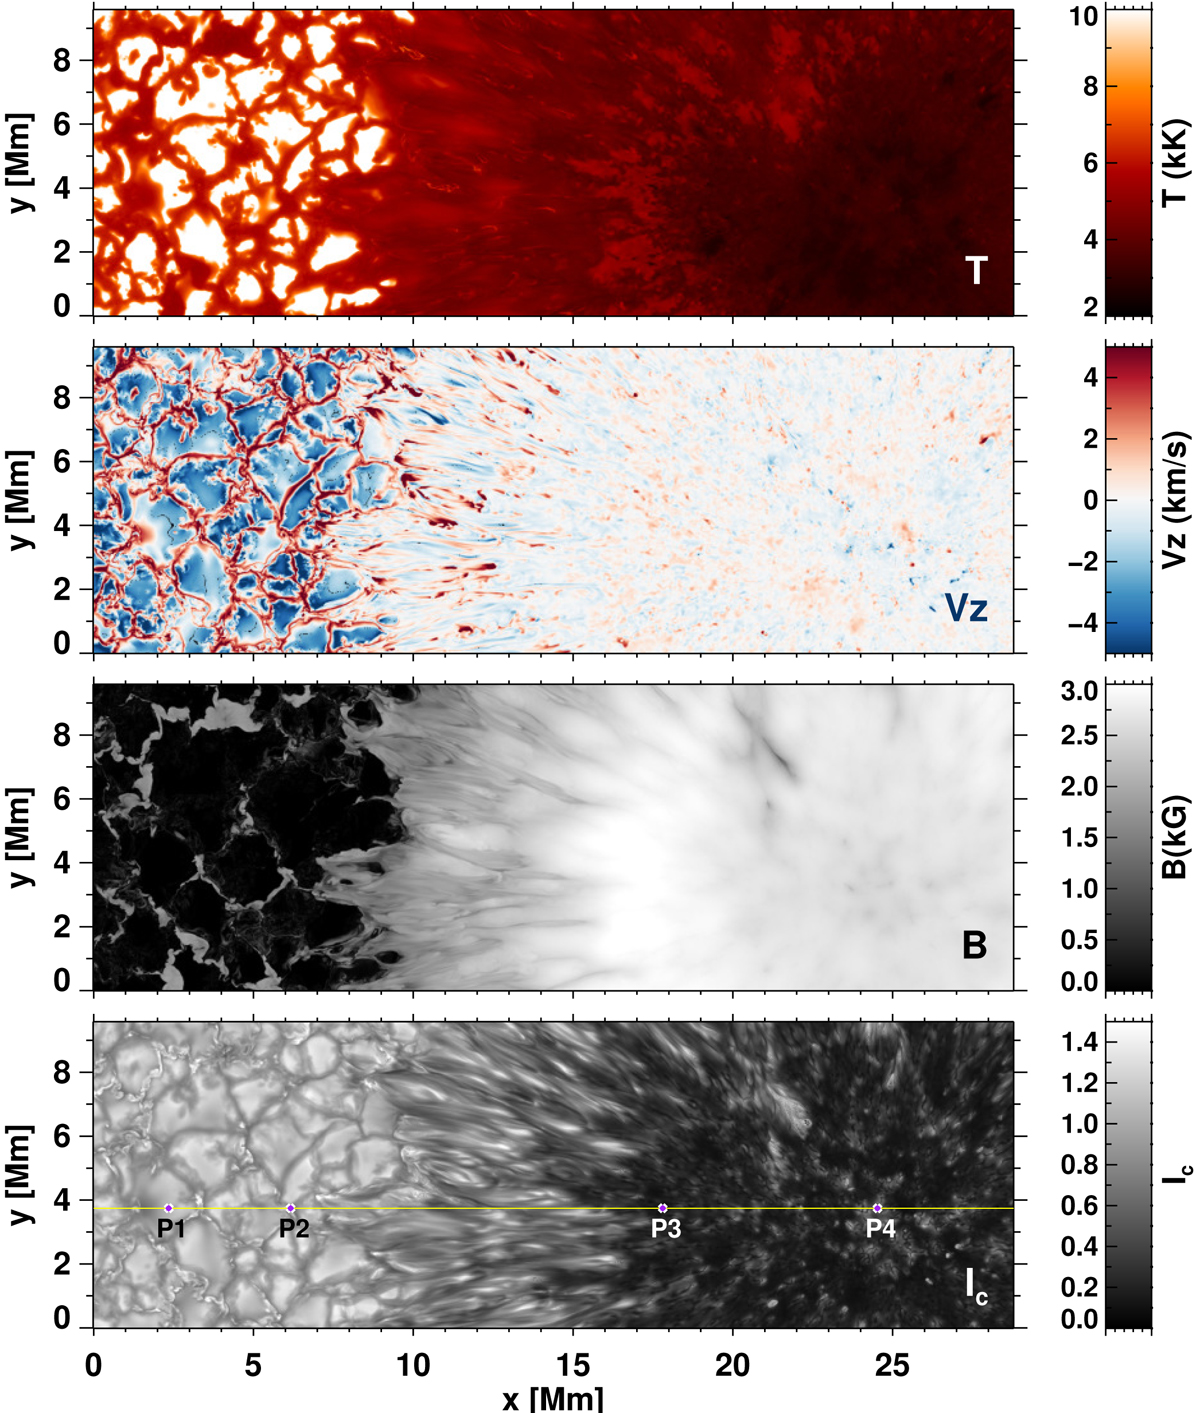
Maps of temperature (first panel), line-of-sight velocity (second panel), and magnetic field strength (third panel) over the chosen region in the MHD cube at a geometric height z = 0 km. Positive velocities denote downflows. The continuum intensity image at 6170 Å is shown in the bottom panel. Here the points P1, P2, P3, and P4 are the four pixels used for a detailed comparison between the Stokes profiles computed in LTE and NLTE.
Current usage metrics show cumulative count of Article Views (full-text article views including HTML views, PDF and ePub downloads, according to the available data) and Abstracts Views on Vision4Press platform.
Data correspond to usage on the plateform after 2015. The current usage metrics is available 48-96 hours after online publication and is updated daily on week days.
Initial download of the metrics may take a while.