Fig. 8.
Download original image
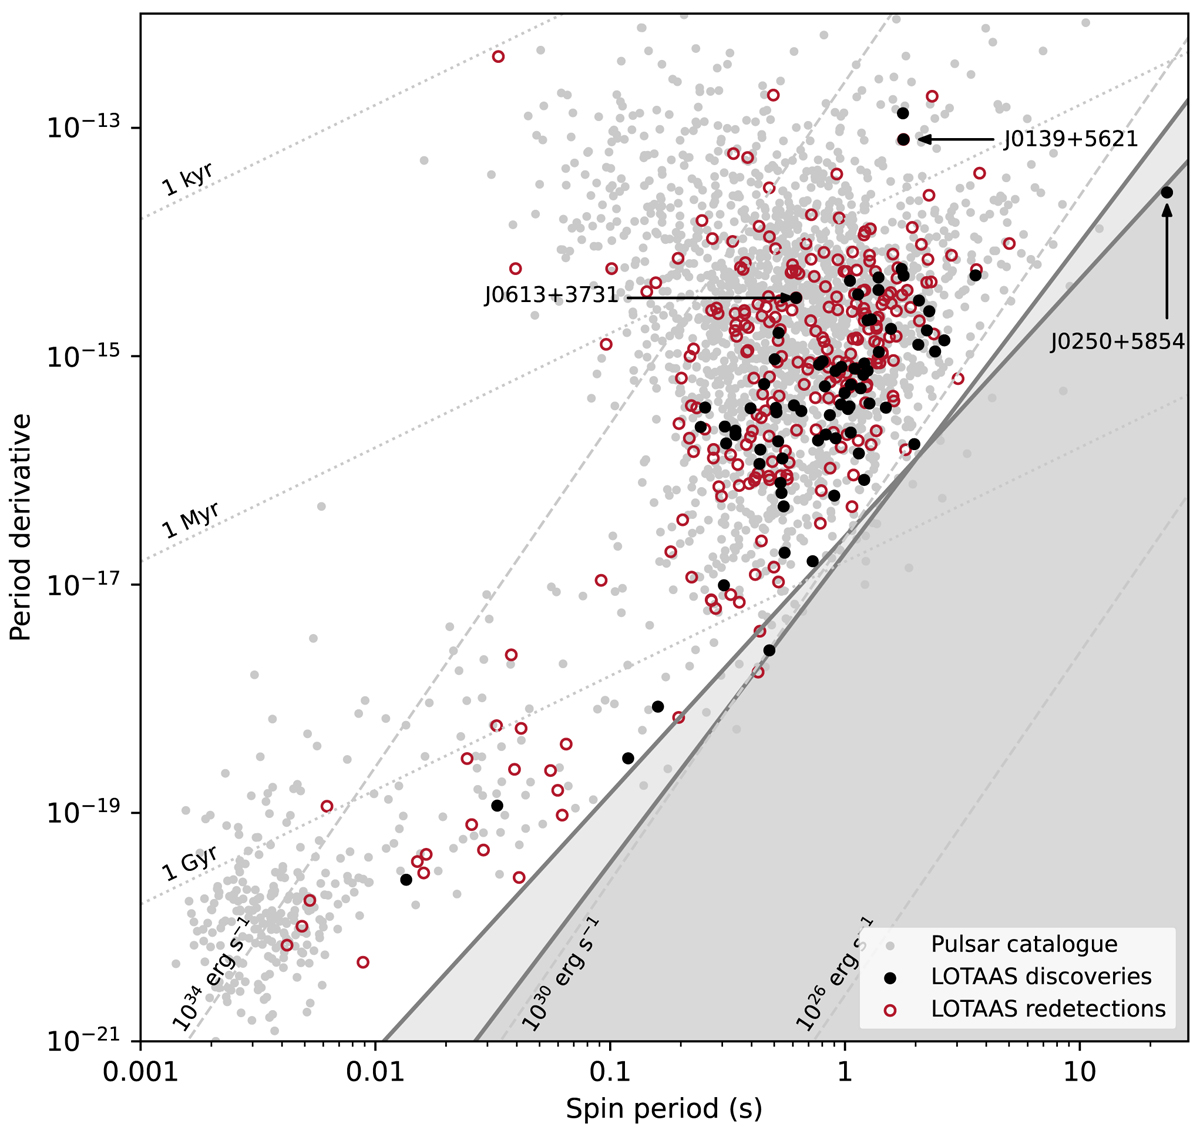
P − Ṗ diagram of the pulsars discovered (black dots) and redetected (red circles) by the LOTAAS survey and the known pulsar population (grey dots). The grey dotted and dashed diagonals represent the characteristic ages and the spin-down luminosities, respectively. The solid lines are deathlines from Chen & Ruderman (1993) and Zhang et al. (2000).
Current usage metrics show cumulative count of Article Views (full-text article views including HTML views, PDF and ePub downloads, according to the available data) and Abstracts Views on Vision4Press platform.
Data correspond to usage on the plateform after 2015. The current usage metrics is available 48-96 hours after online publication and is updated daily on week days.
Initial download of the metrics may take a while.