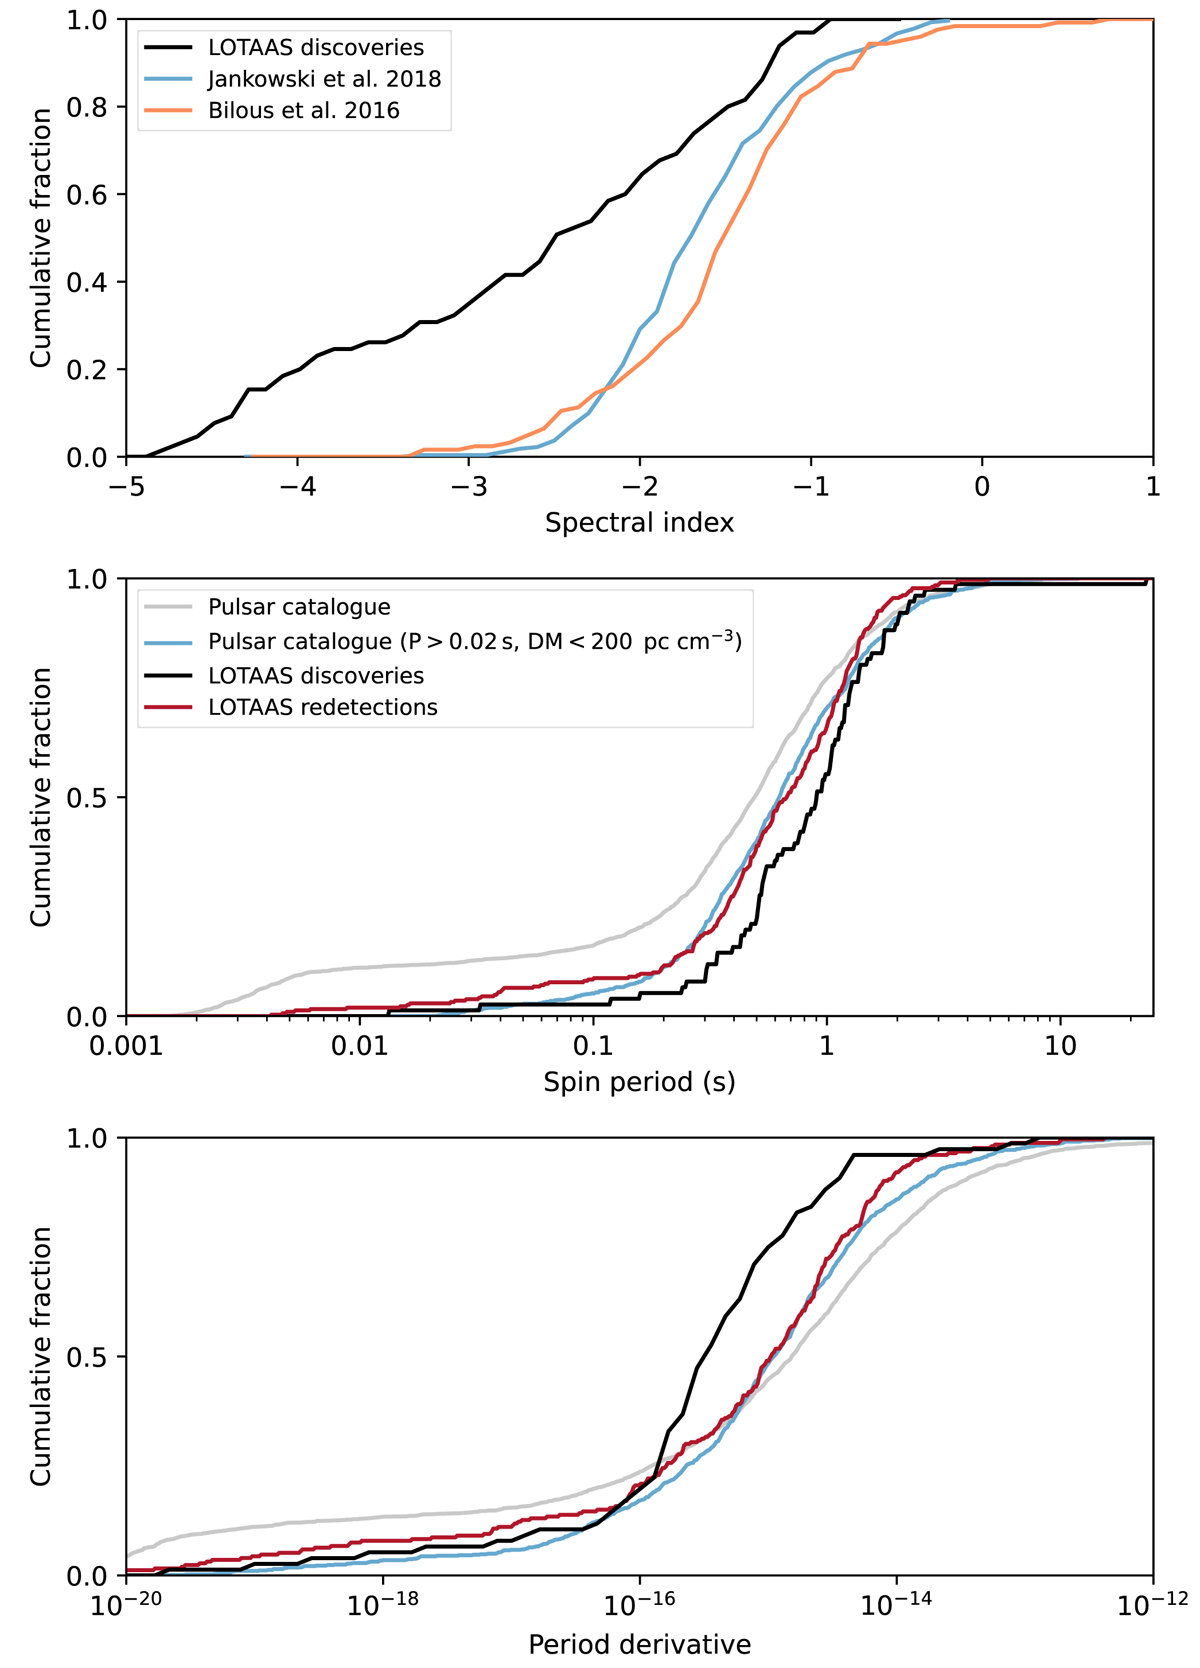
Fig. 7.
Download original image
Cumulative distributions of the spectral index, the spin period, and the period derivative of the pulsars discovered by the LOTAAS survey (black). The upper plot displays spectral indices from Jankowski et al. (2018; blue) and Bilous et al. (2016; orange). We emphasise that due to the uncertainties in the flux calibration of the LOTAAS obervations, the LOTAAS spectral indices should not be used for detailed studies. The lower plots show the LOTAAS redetections (red), the known pulsar population (grey), and a subset of the known pulsar population limited to P > 0.02 s and DM < 200 pc cm−3 (blue).
Current usage metrics show cumulative count of Article Views (full-text article views including HTML views, PDF and ePub downloads, according to the available data) and Abstracts Views on Vision4Press platform.
Data correspond to usage on the plateform after 2015. The current usage metrics is available 48-96 hours after online publication and is updated daily on week days.
Initial download of the metrics may take a while.