Fig. 6.
Download original image
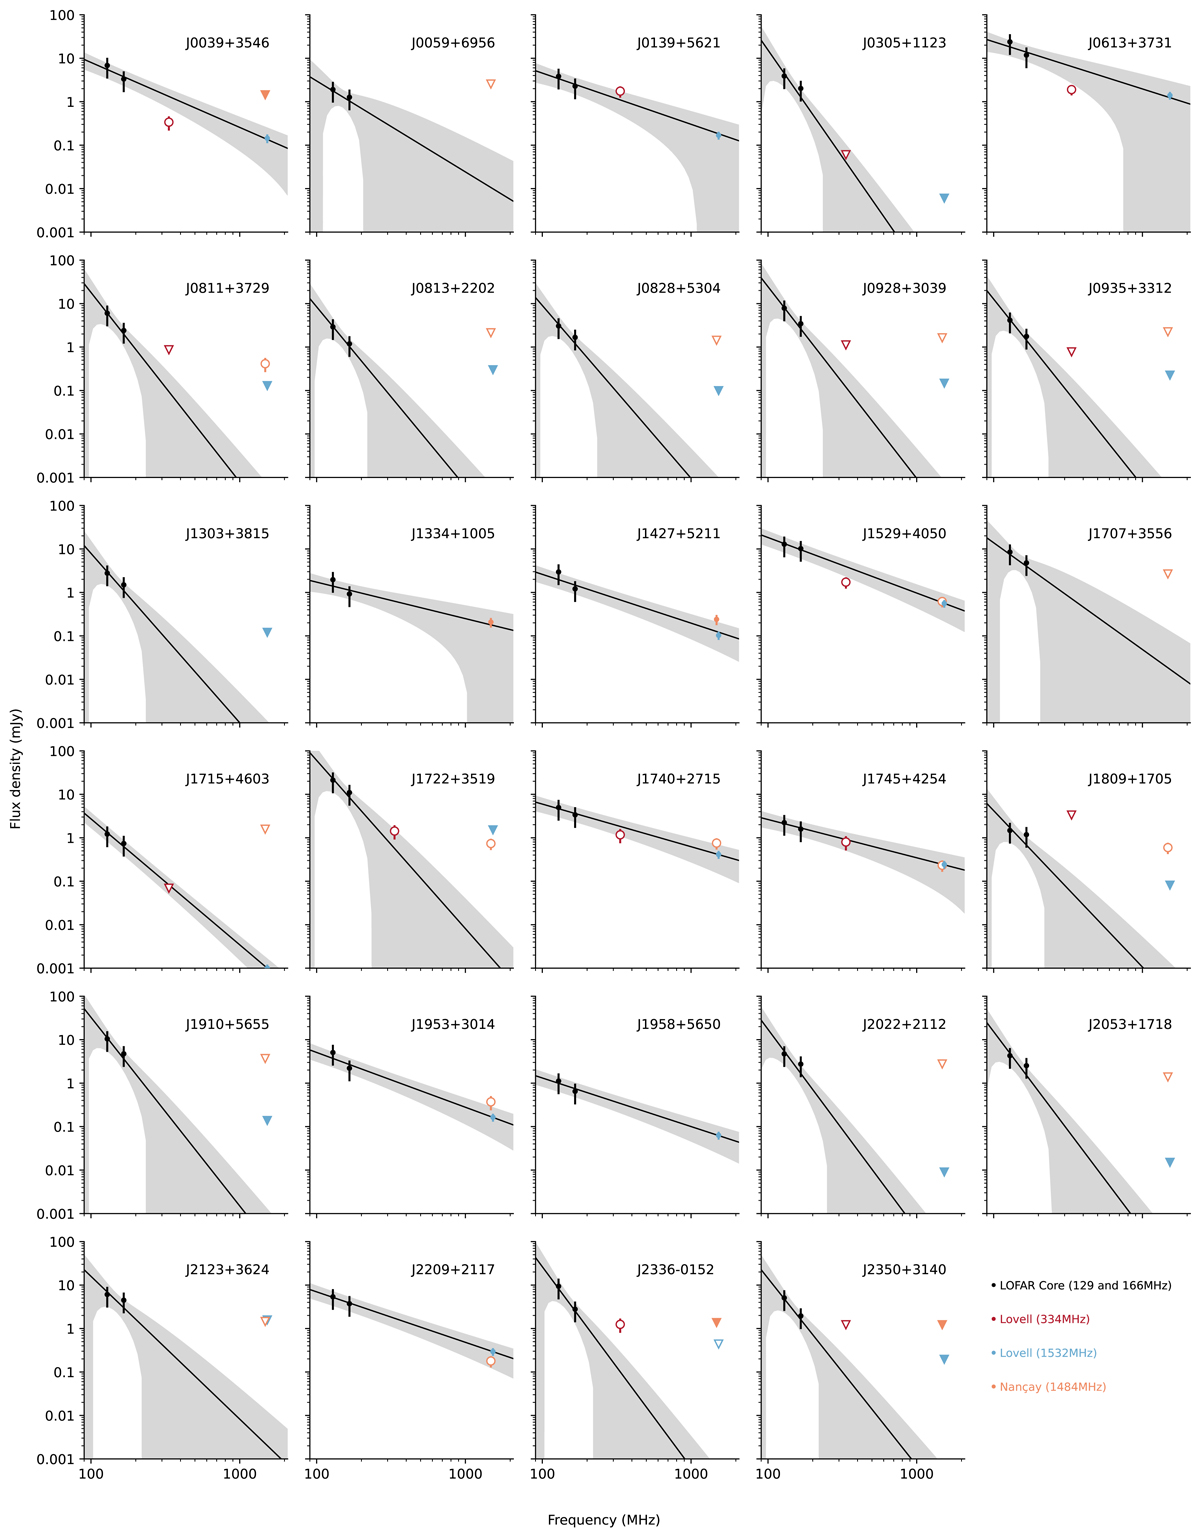
Mean flux densities (dots and circles) and upper limits for flux densities (triangles) as reported in Table 5 for the 29 pulsars whose timing positions fall within the FWHM of the LOFAR Core tied-array beam. Filled dots and triangles are flux density measurements for which five or more observations were available, while empty circles and triangles are measurements from less than five observations. The black lines represent fitted spectral indices, which are the mean values for the spectral index α and the flux density on the reference frequency of 149 MHz S0 from the EMCEE samples. The shaded regions represent the uncertainty on α and S0 propagated to flux densities between 90 and 2100 MHz. For the spectral index fit, only flux density measurements with five or more observations were used.
Current usage metrics show cumulative count of Article Views (full-text article views including HTML views, PDF and ePub downloads, according to the available data) and Abstracts Views on Vision4Press platform.
Data correspond to usage on the plateform after 2015. The current usage metrics is available 48-96 hours after online publication and is updated daily on week days.
Initial download of the metrics may take a while.