Open Access
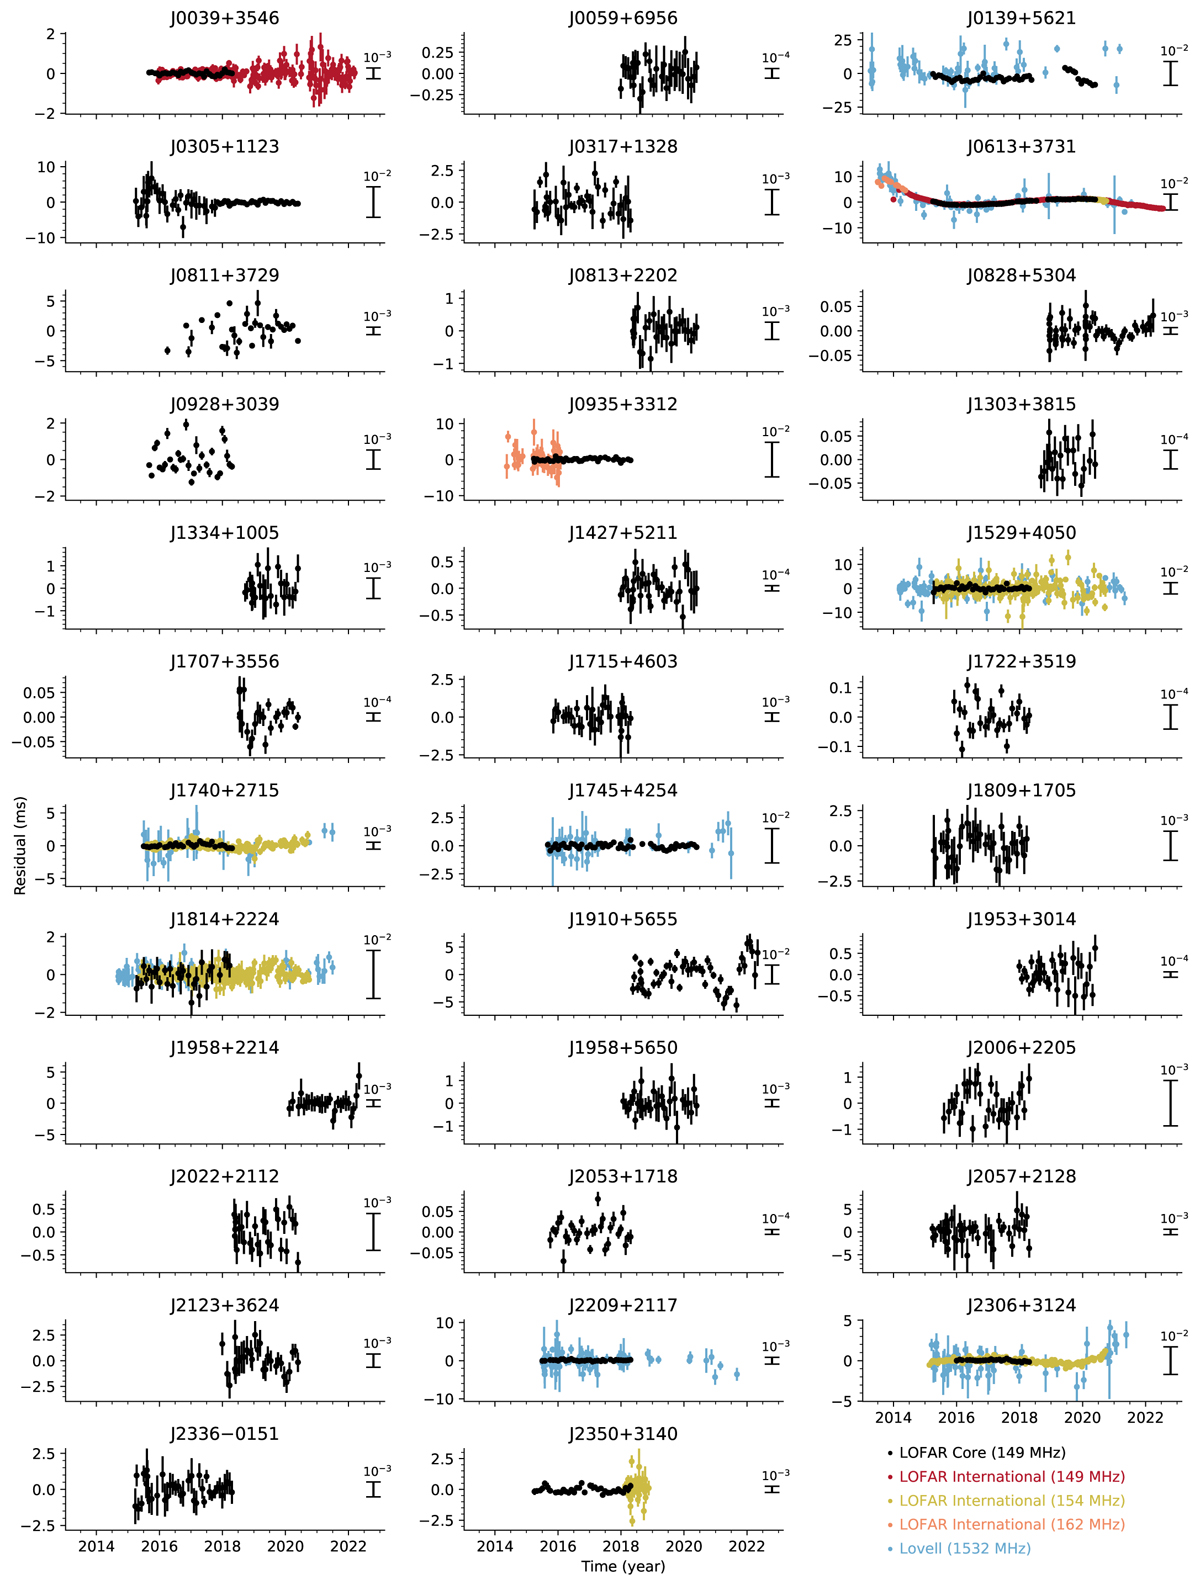
Fig. 1.
Download original image
Residuals from the timing model in Table 2 for all 35 pulsars. The different colours represent different instruments as indicated in the bottom-right corner. The black bars on the right side of each panel show the scale of the proportion of the spin period.
Current usage metrics show cumulative count of Article Views (full-text article views including HTML views, PDF and ePub downloads, according to the available data) and Abstracts Views on Vision4Press platform.
Data correspond to usage on the plateform after 2015. The current usage metrics is available 48-96 hours after online publication and is updated daily on week days.
Initial download of the metrics may take a while.