Open Access
Fig. 4.
Download original image
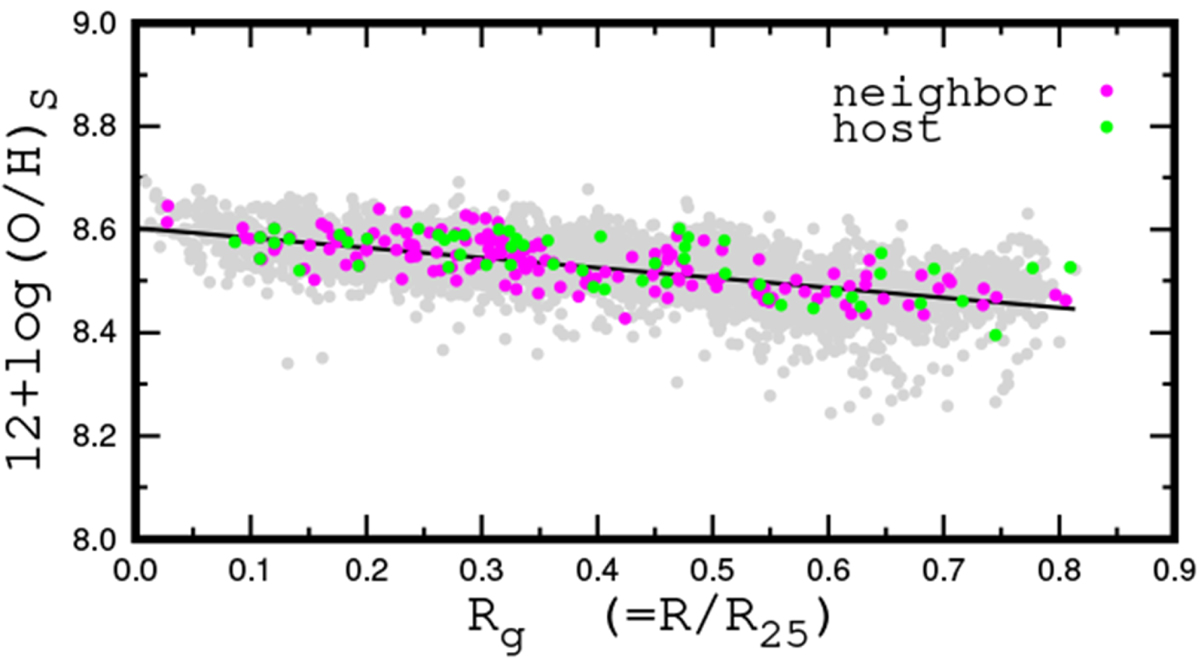
Radial distribution of the oxygen abundance. The grey points denote the oxygen abundance of the individual fibers. The solid line is the best fit to the data. The green points mark the fibers hosting SNRs, while the magenta points correspond to the neighboring fibers to the SNRs positions.
Current usage metrics show cumulative count of Article Views (full-text article views including HTML views, PDF and ePub downloads, according to the available data) and Abstracts Views on Vision4Press platform.
Data correspond to usage on the plateform after 2015. The current usage metrics is available 48-96 hours after online publication and is updated daily on week days.
Initial download of the metrics may take a while.