Fig. 3.
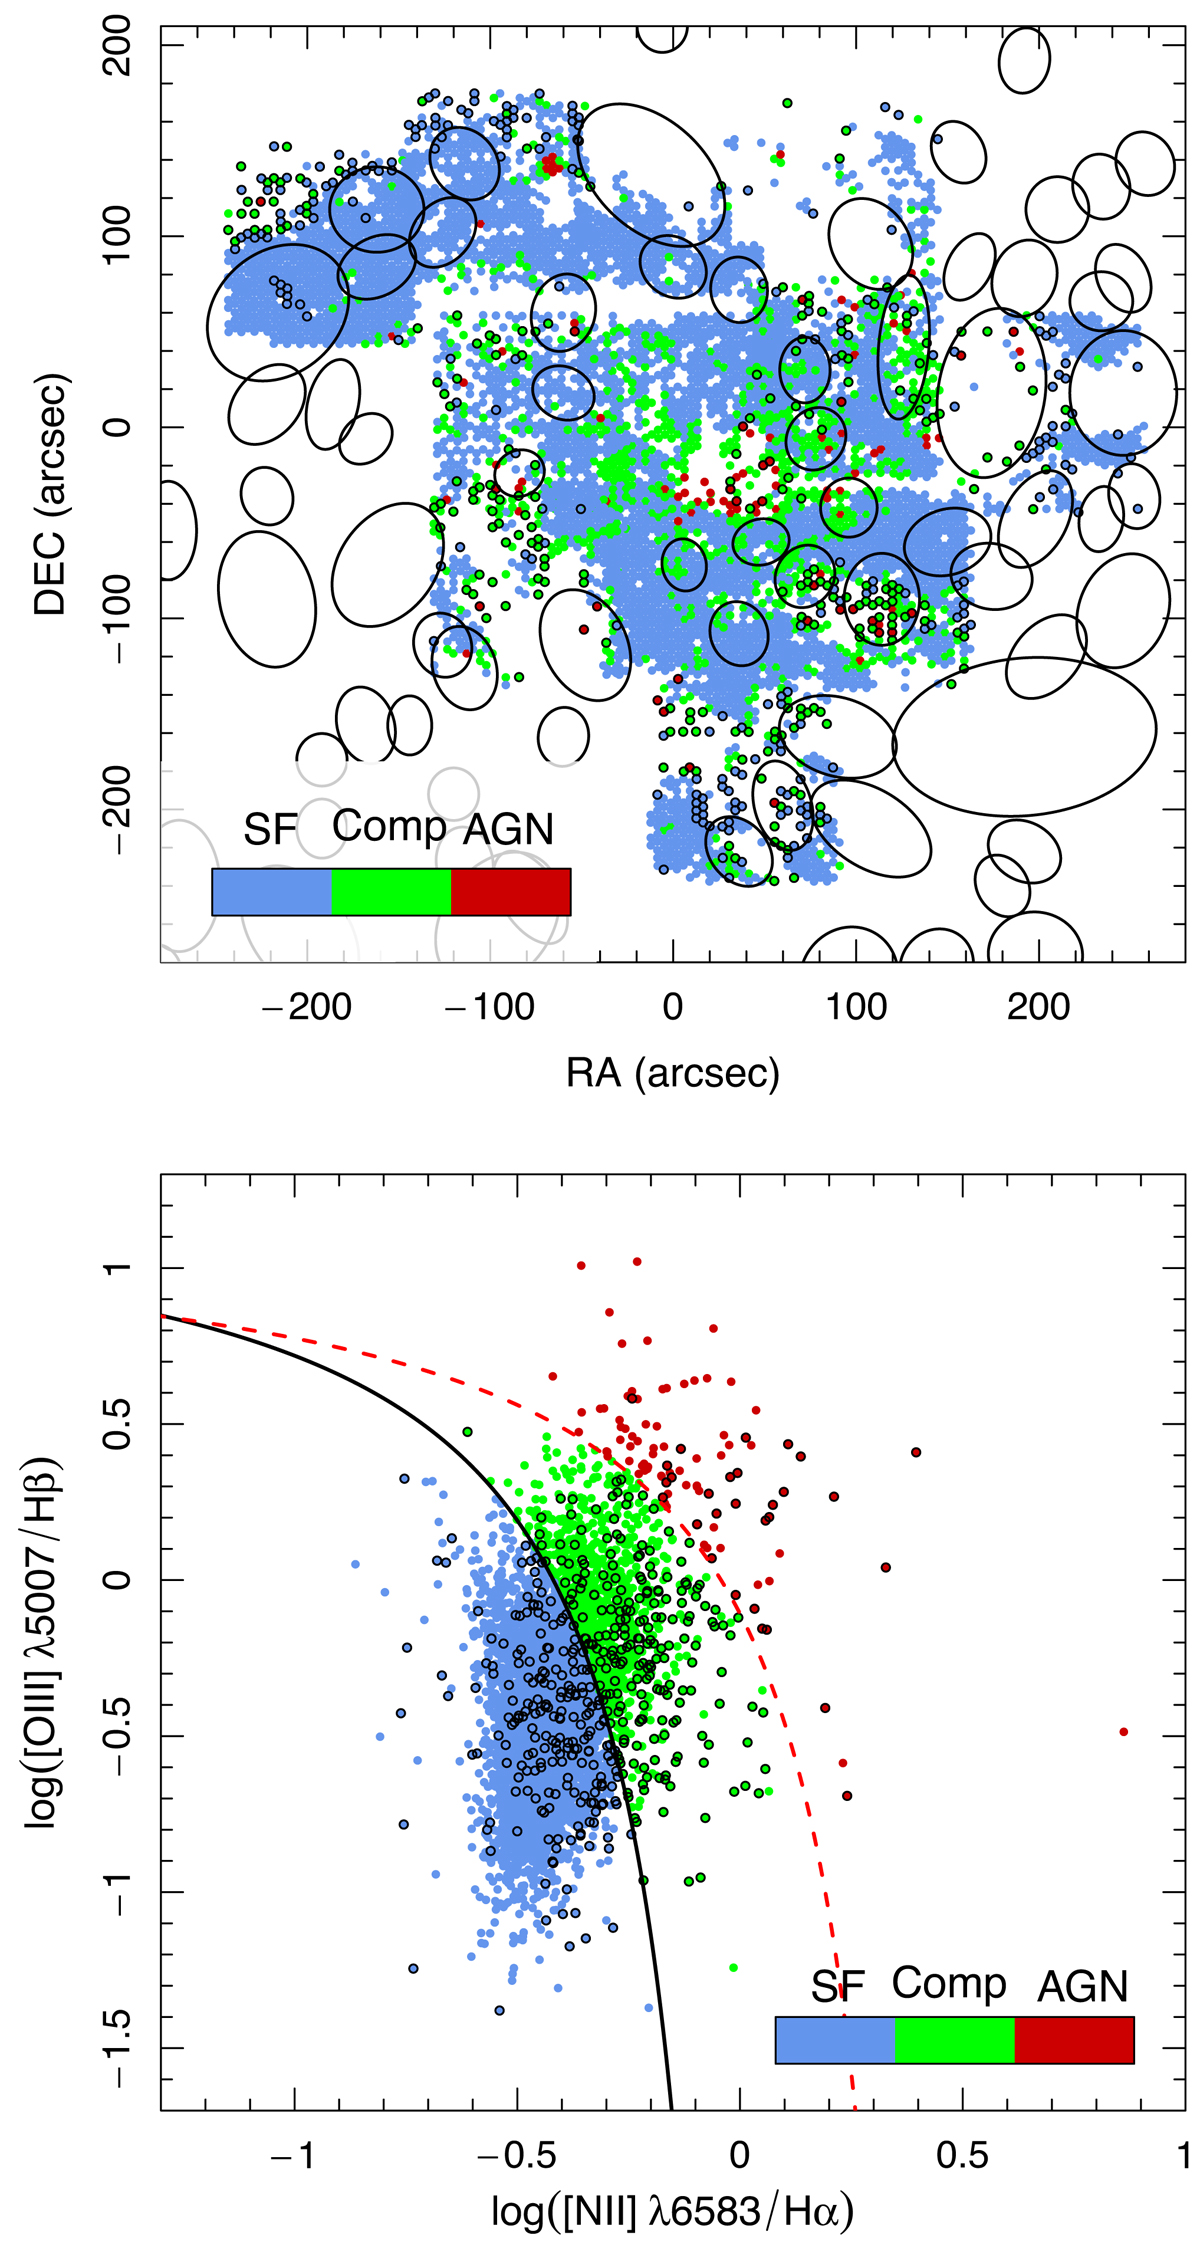
Download original image
BPT classification in NGC 6946. Top panel: Map of the BPT classification, color-coded as indicated in the label. Bottom panel: BPT diagram for the individual fibers with SF-like spectra (blue symbols), Composite (green symbols), and AGN-like (red symbols). The black solid and red dashed curves are the demarcation lines between SF and AGN regions defined by Kauffmann et al. (2003) and Kewley et al. (2001), respectively. The ellipses in the top panel indicate the H I holes (see Sect. 4.2), while the small black circles denote regions dominated by DIG.
Current usage metrics show cumulative count of Article Views (full-text article views including HTML views, PDF and ePub downloads, according to the available data) and Abstracts Views on Vision4Press platform.
Data correspond to usage on the plateform after 2015. The current usage metrics is available 48-96 hours after online publication and is updated daily on week days.
Initial download of the metrics may take a while.