Fig. 1.
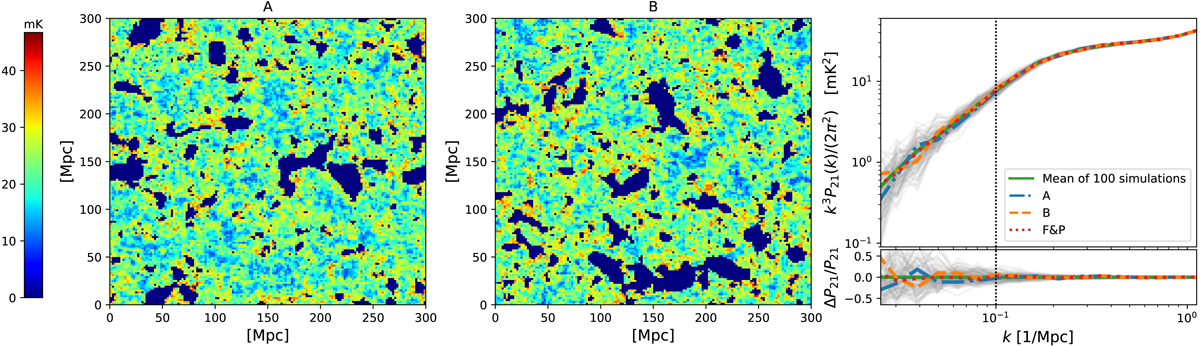
Download original image
Example of a pair of fixed simulations. First and second panel: slices of fixed and paired reionization simulations (A and B) at z = 9 (with a mean neutral fraction of xHI = 0.8). The colour map shows the differential brightness temperature between 0 and 50 mK. Third panel: 21 cm power spectra of the same paired simulations (blue and orange) along with those of 100 independent traditional simulations (grey lines). The mean power spectra of the traditional simulations and the two F&P simulations are shown as solid green and dotted red lines, respectively. For reference, the expected largest scale probed by SKA, k = 0.1 Mpc−1, is marked with a vertical line.
Current usage metrics show cumulative count of Article Views (full-text article views including HTML views, PDF and ePub downloads, according to the available data) and Abstracts Views on Vision4Press platform.
Data correspond to usage on the plateform after 2015. The current usage metrics is available 48-96 hours after online publication and is updated daily on week days.
Initial download of the metrics may take a while.