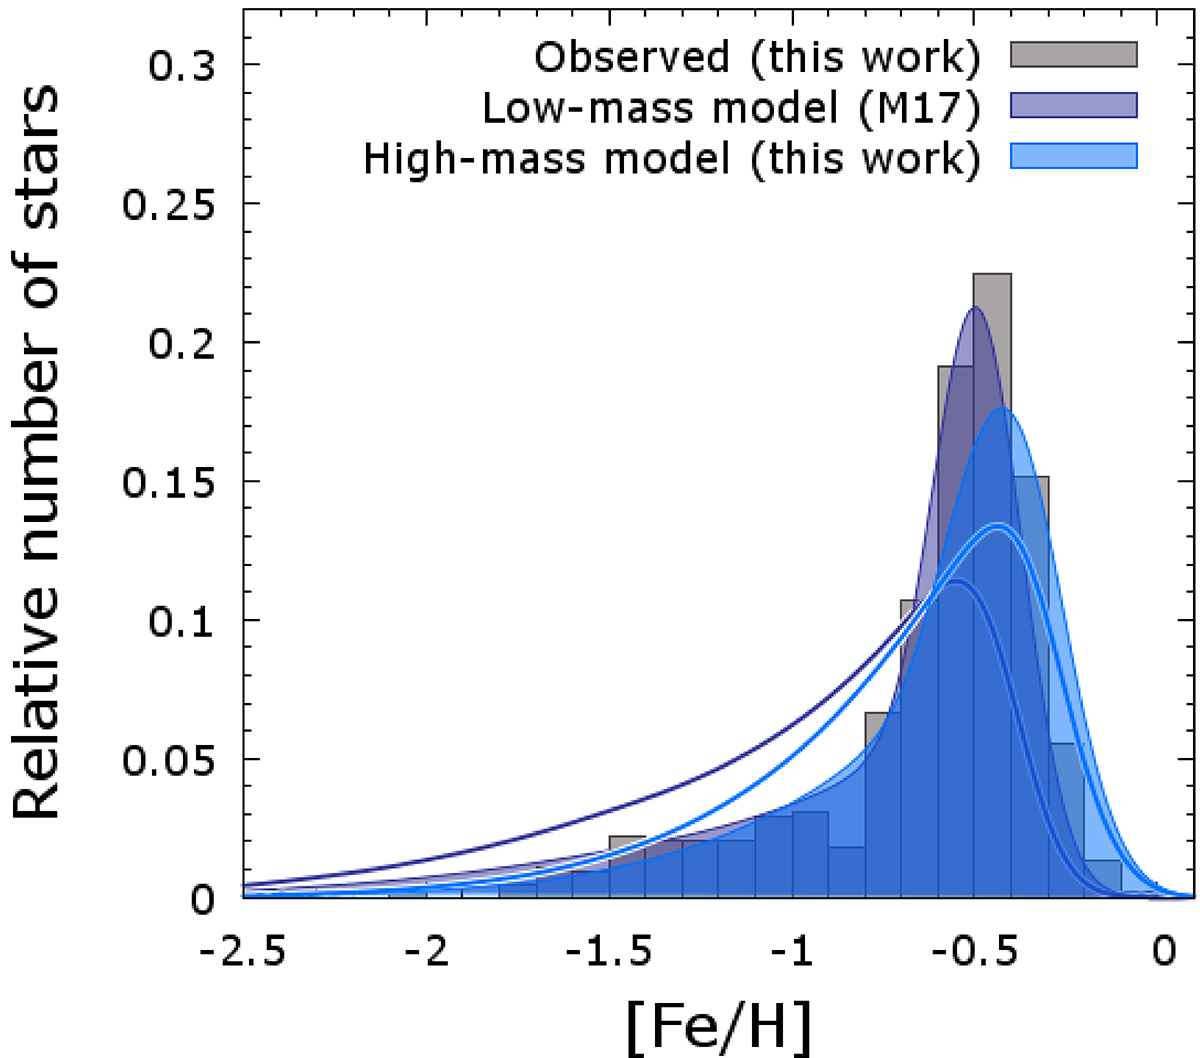
Fig. 8.
Download original image
Comparison between the MDF derived in this work (grey shaded histogram) and those predicted from the chemical evolution models by M17 and its revised version presented here. The MDF from the original models is presented as the empty curves, while the coloured shaded curves show the same distributions after removal of 75% (M17 model) and 50% (new model) of the metal-poor stars ([Fe/H] < −0.6). The distributions are normalised to have a unit area.
Current usage metrics show cumulative count of Article Views (full-text article views including HTML views, PDF and ePub downloads, according to the available data) and Abstracts Views on Vision4Press platform.
Data correspond to usage on the plateform after 2015. The current usage metrics is available 48-96 hours after online publication and is updated daily on week days.
Initial download of the metrics may take a while.