Fig. 6.
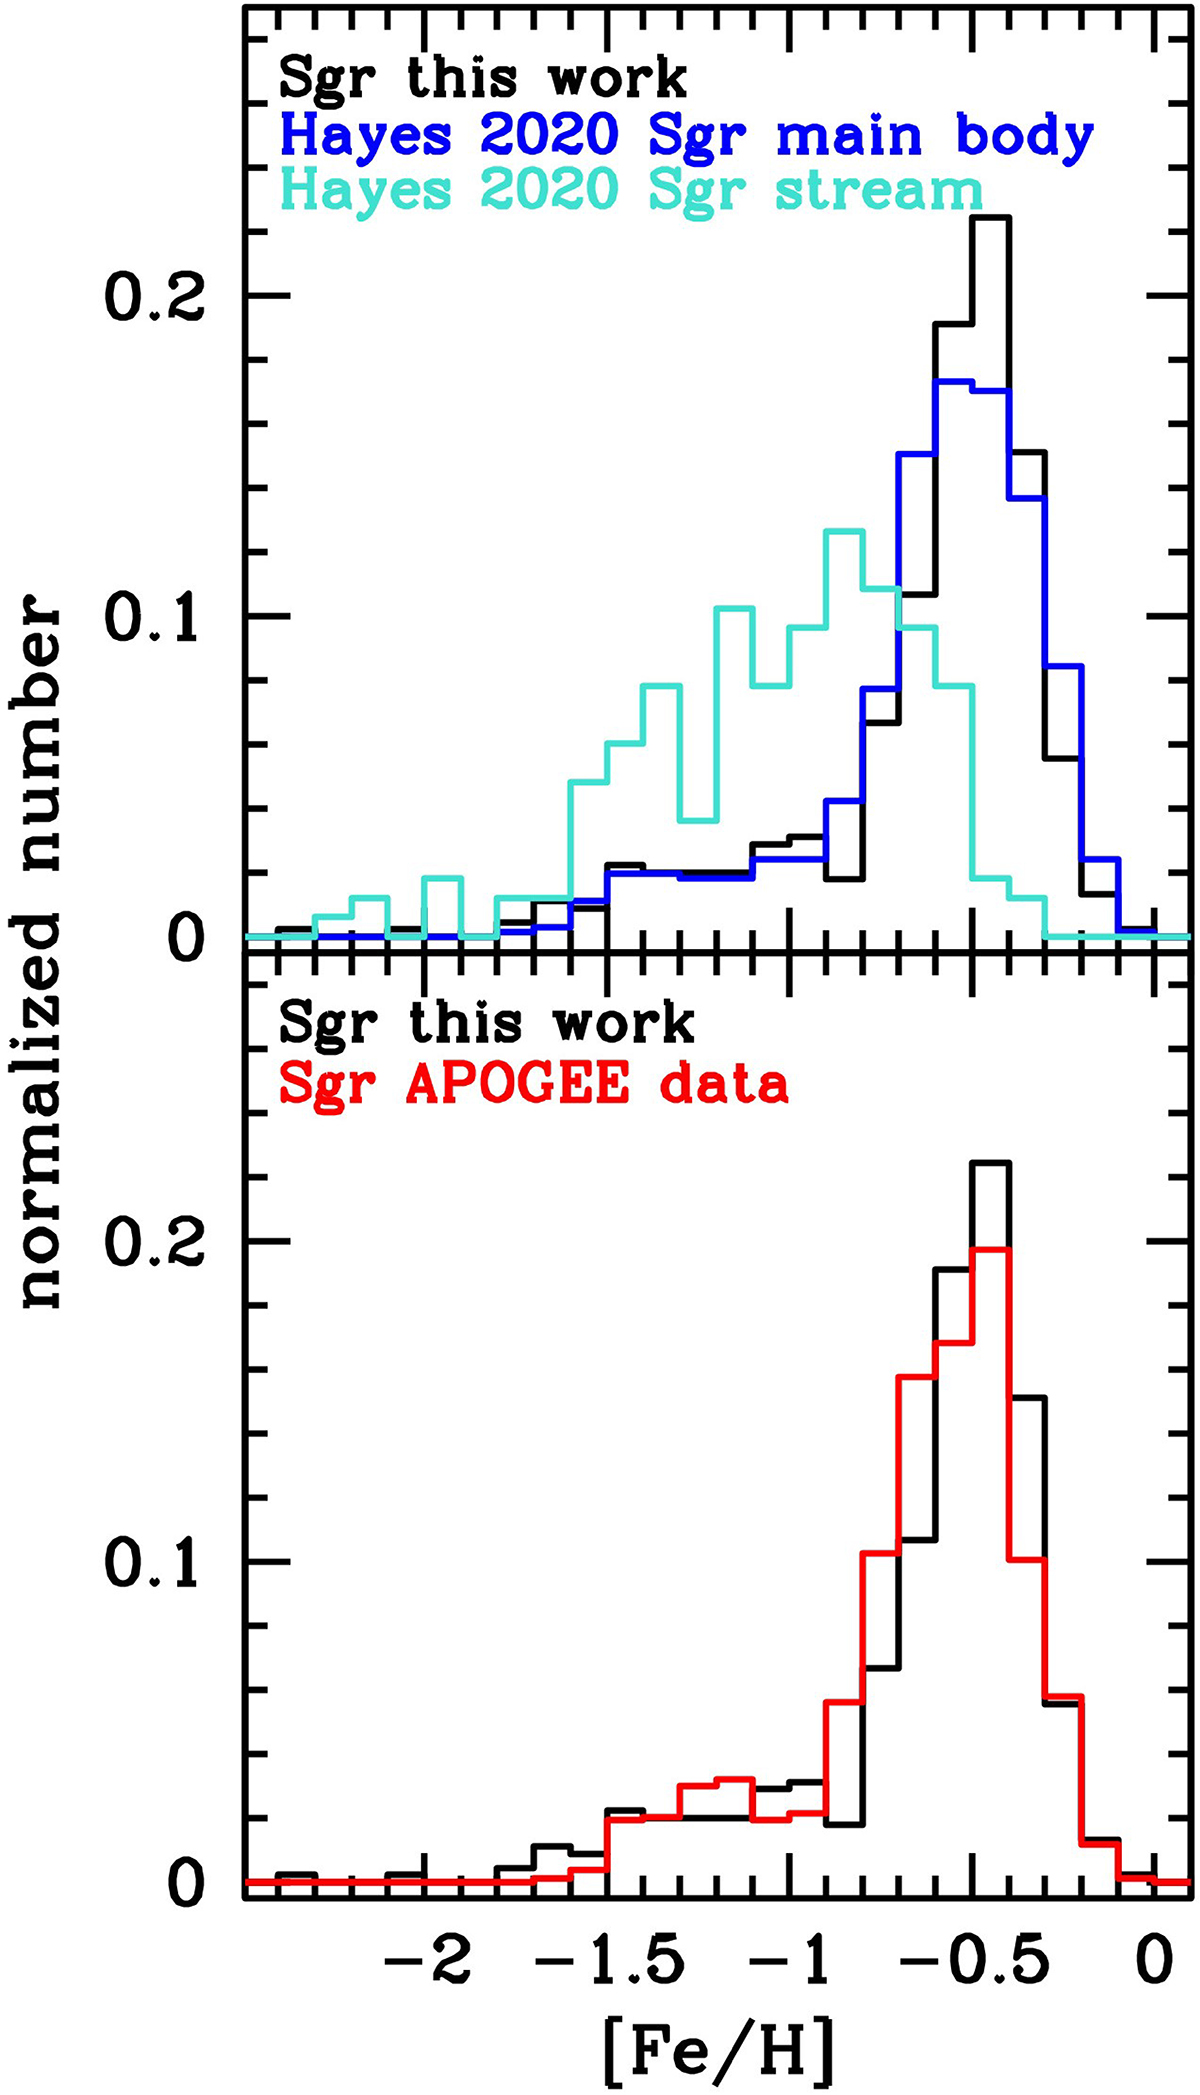
Download original image
Upper panel: comparison between the metallicity distribution derived in this work (black line) with those derived by Hayes et al. (2020, H20 samples) for Sgr main body (blue line; 710 stars) and Sgr stream stars (light blue line; 166 stars). Lower panel: Same comparison, but with the Sgr APOGEE DR17 H21 sample (red line; 1034 stars). The distributions are normalised to have a unit area.
Current usage metrics show cumulative count of Article Views (full-text article views including HTML views, PDF and ePub downloads, according to the available data) and Abstracts Views on Vision4Press platform.
Data correspond to usage on the plateform after 2015. The current usage metrics is available 48-96 hours after online publication and is updated daily on week days.
Initial download of the metrics may take a while.