Open Access
Fig. 5.
Download original image
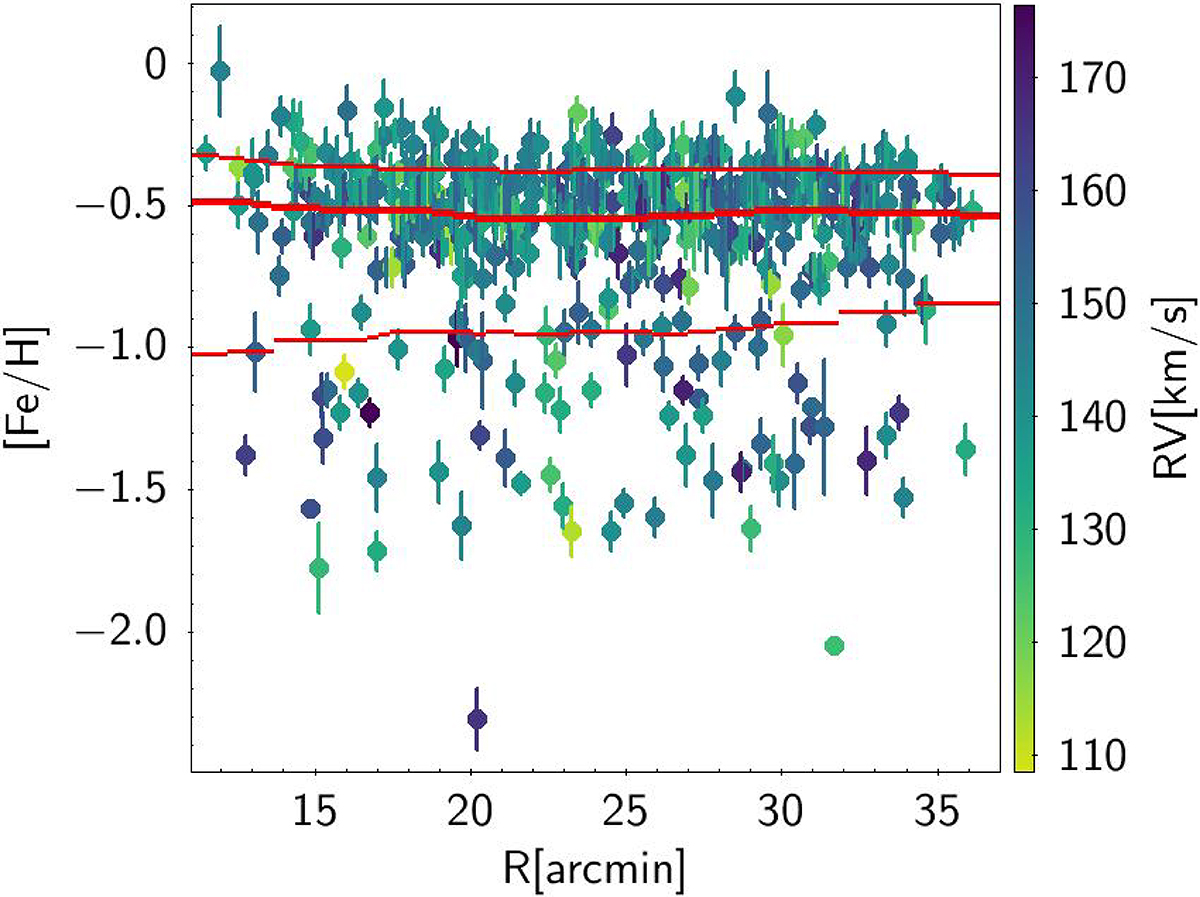
Iron abundance of the surveyed stars as a function of the angular distance from the centre of the Sgr galaxy. Stars are colour-coded according to their RV. The thick red line is the running median smoothed over 8′ radial bins, while the thin red lines mark the 16th and 84th percentiles of the [Fe/H] distribution.
Current usage metrics show cumulative count of Article Views (full-text article views including HTML views, PDF and ePub downloads, according to the available data) and Abstracts Views on Vision4Press platform.
Data correspond to usage on the plateform after 2015. The current usage metrics is available 48-96 hours after online publication and is updated daily on week days.
Initial download of the metrics may take a while.