Fig. 4.
Download original image
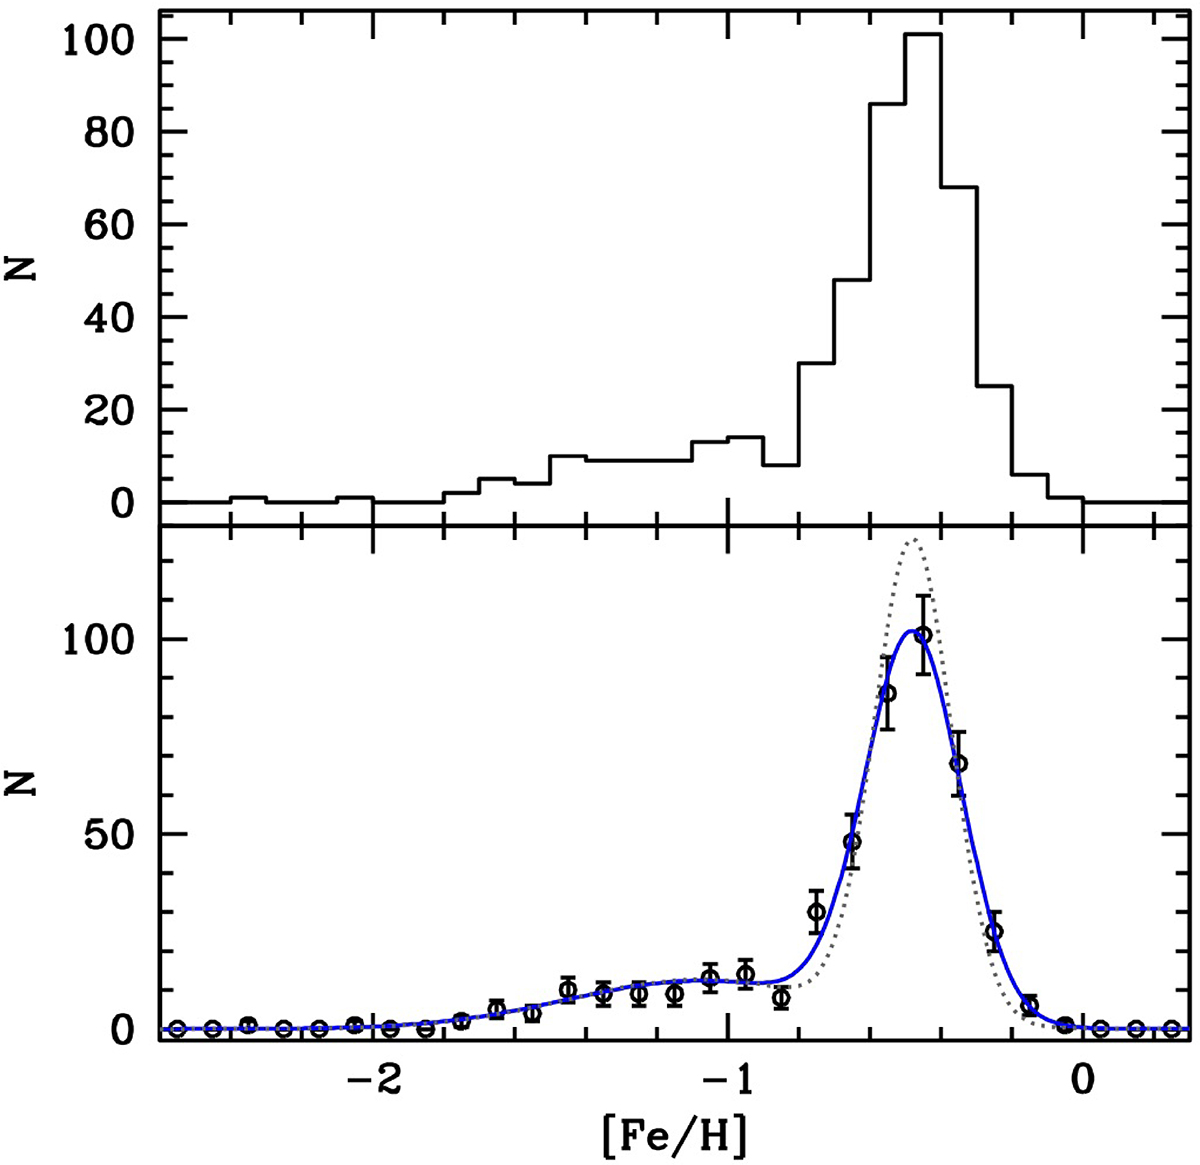
Upper panel: metallicity distribution of the target stars displayed as a normal histogram. Lower panel: same distribution represented as points with Poisson error bars. The dotted grey curve is the best-fit two-Gaussian model with the estimated intrinsic σ values, while the continuous blue curve is the same model convolved with the mean uncertainty of individual [Fe/H] measures (0.08 dex).
Current usage metrics show cumulative count of Article Views (full-text article views including HTML views, PDF and ePub downloads, according to the available data) and Abstracts Views on Vision4Press platform.
Data correspond to usage on the plateform after 2015. The current usage metrics is available 48-96 hours after online publication and is updated daily on week days.
Initial download of the metrics may take a while.