Fig. 7
Download original image
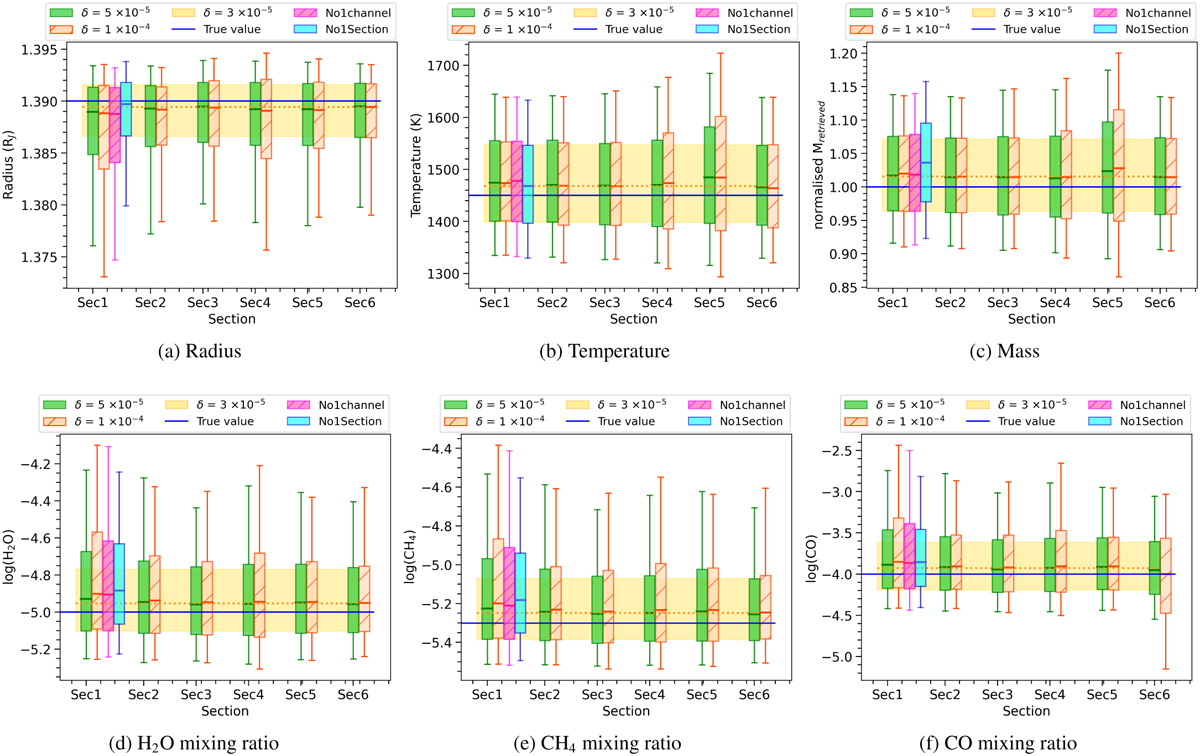
Test of the impact of the S/N in each of the selected range of the spectrum performed on the primordial atmosphere of the hot Jupiter around an 8th magnitude G star. In green, we show the retrieval performed considering an error of about 5 × 10⁻⁵. In orange, the retrieval obtained with an error of about 1 × 10⁻⁴. Yellow band highlights the values retrieved in the original case (δ ≃ 3 × 10⁻⁵). Magenta and cyan boxes represent the distributions of the values obtained by performing the retrieval without the first point or without the entire section 1 of Fig. 6, respectively. Blue line highlights the true value.
Current usage metrics show cumulative count of Article Views (full-text article views including HTML views, PDF and ePub downloads, according to the available data) and Abstracts Views on Vision4Press platform.
Data correspond to usage on the plateform after 2015. The current usage metrics is available 48-96 hours after online publication and is updated daily on week days.
Initial download of the metrics may take a while.