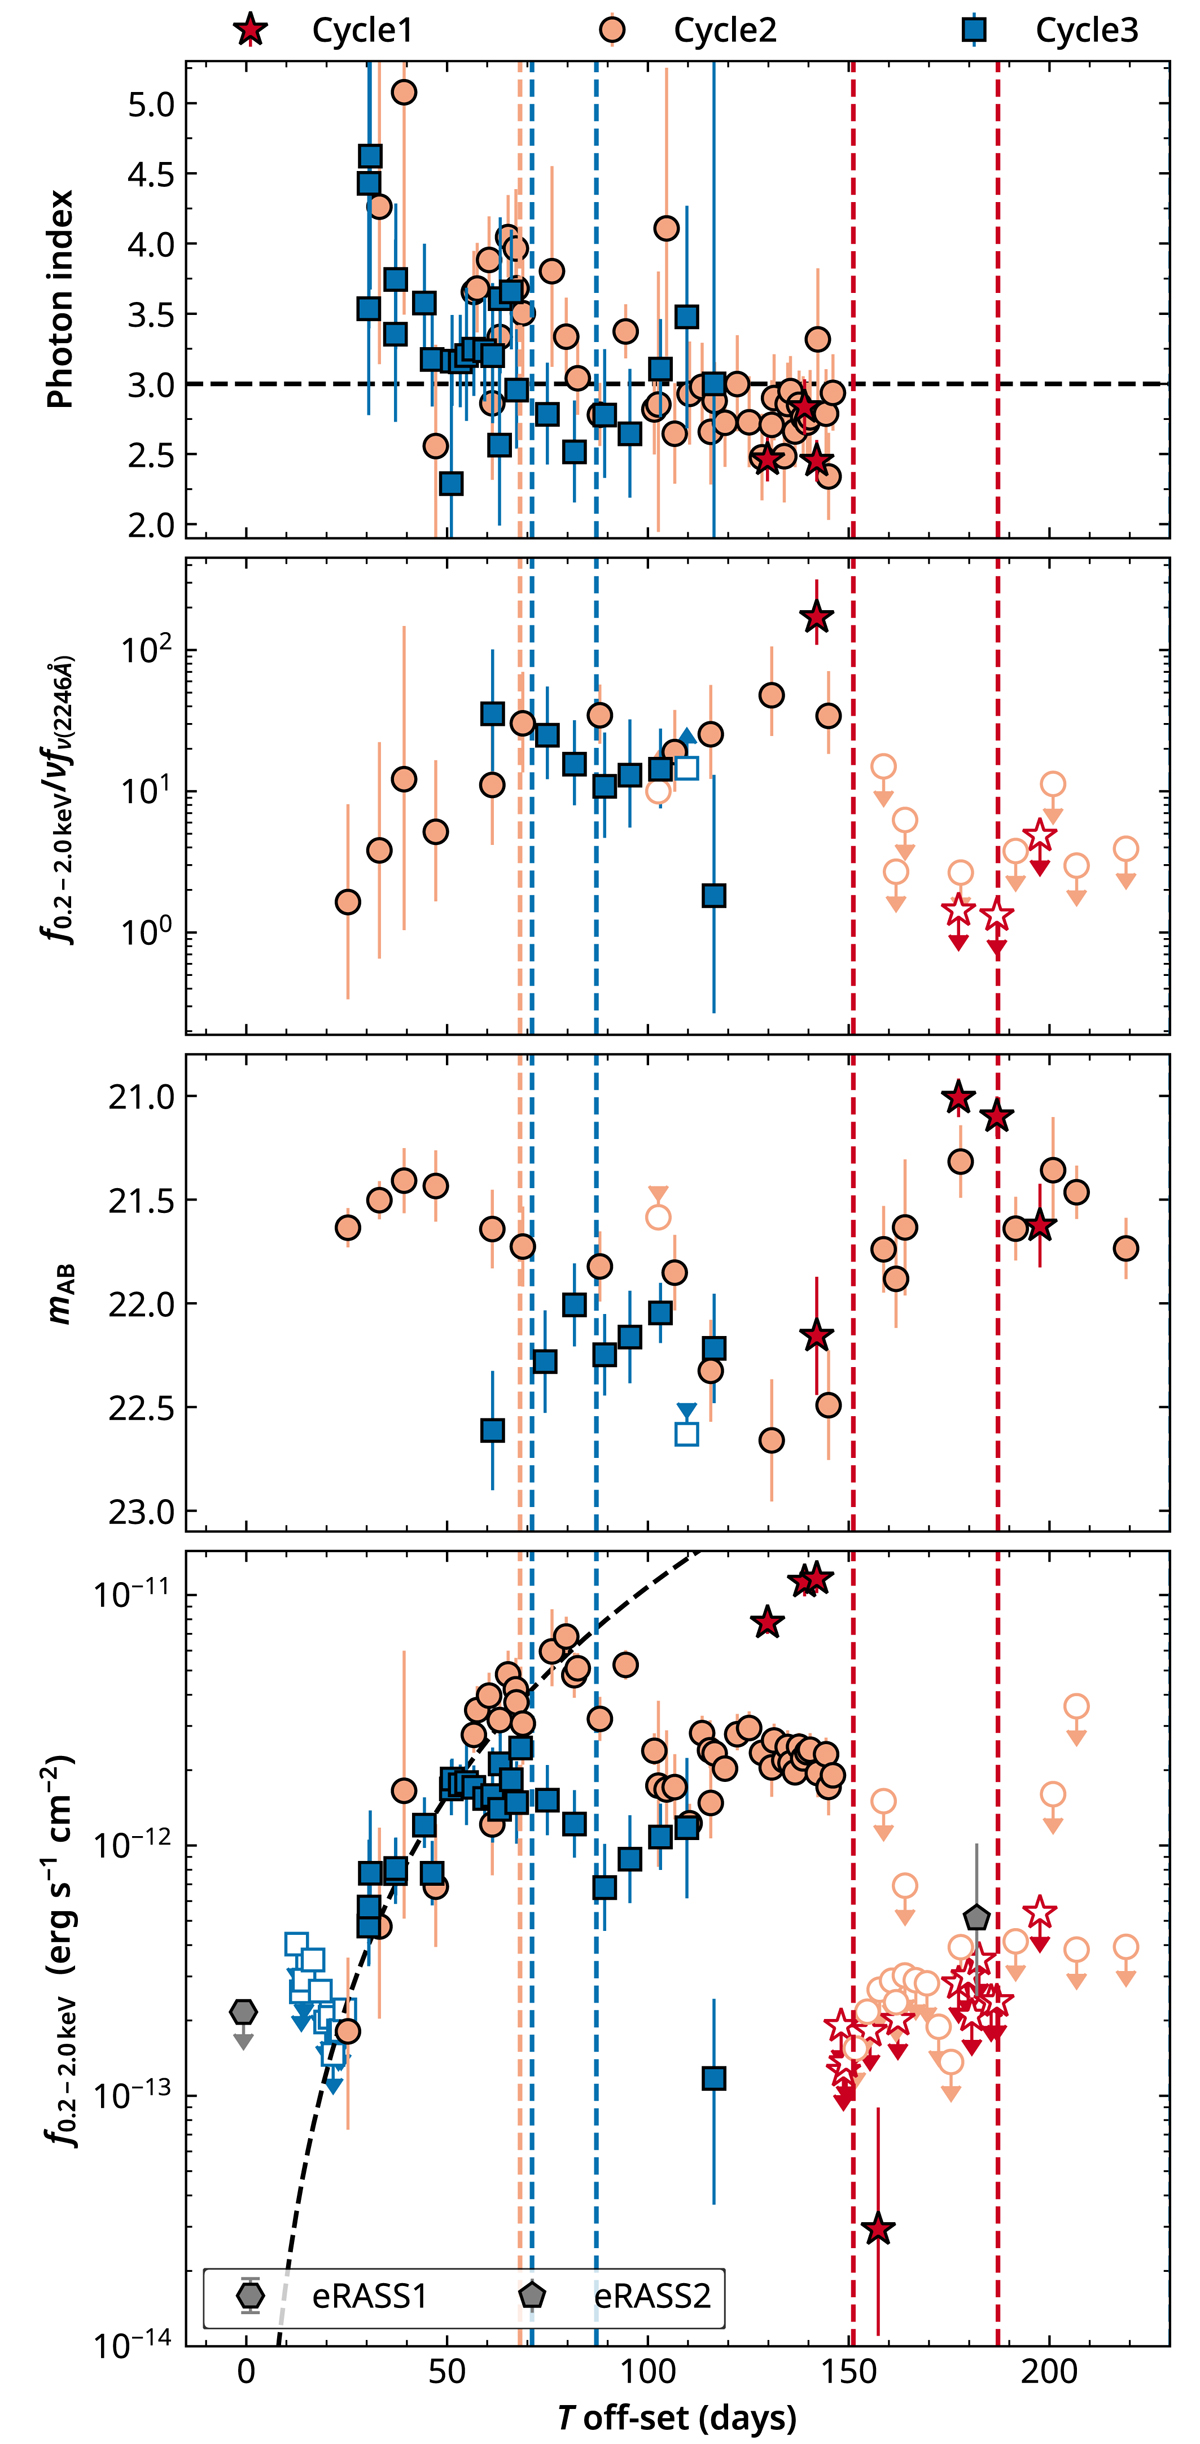
Fig. 8.
Download original image
From top to bottom: evolution of the photon index (measured using the Mpl model), ratio of the f0.2 − 2.0 keV to the 2246 Å monochromatic flux, apparent UVM2 AB magnitude, and log(f0.2 − 2.0 keV) against the time offset. The time off-set is calculated relative to the inferred t0 assuming a period of 223 days. The whole data set was split into three cycles that were determined by the time when the rapid X-ray flux drop occurred. The vertical dashed lines represent the time (relative to t0 of each cycle) of the ATCA radio observations. Radio emission was detected only in cycle 3 (dashed blue lines).
Current usage metrics show cumulative count of Article Views (full-text article views including HTML views, PDF and ePub downloads, according to the available data) and Abstracts Views on Vision4Press platform.
Data correspond to usage on the plateform after 2015. The current usage metrics is available 48-96 hours after online publication and is updated daily on week days.
Initial download of the metrics may take a while.