Fig. 6.
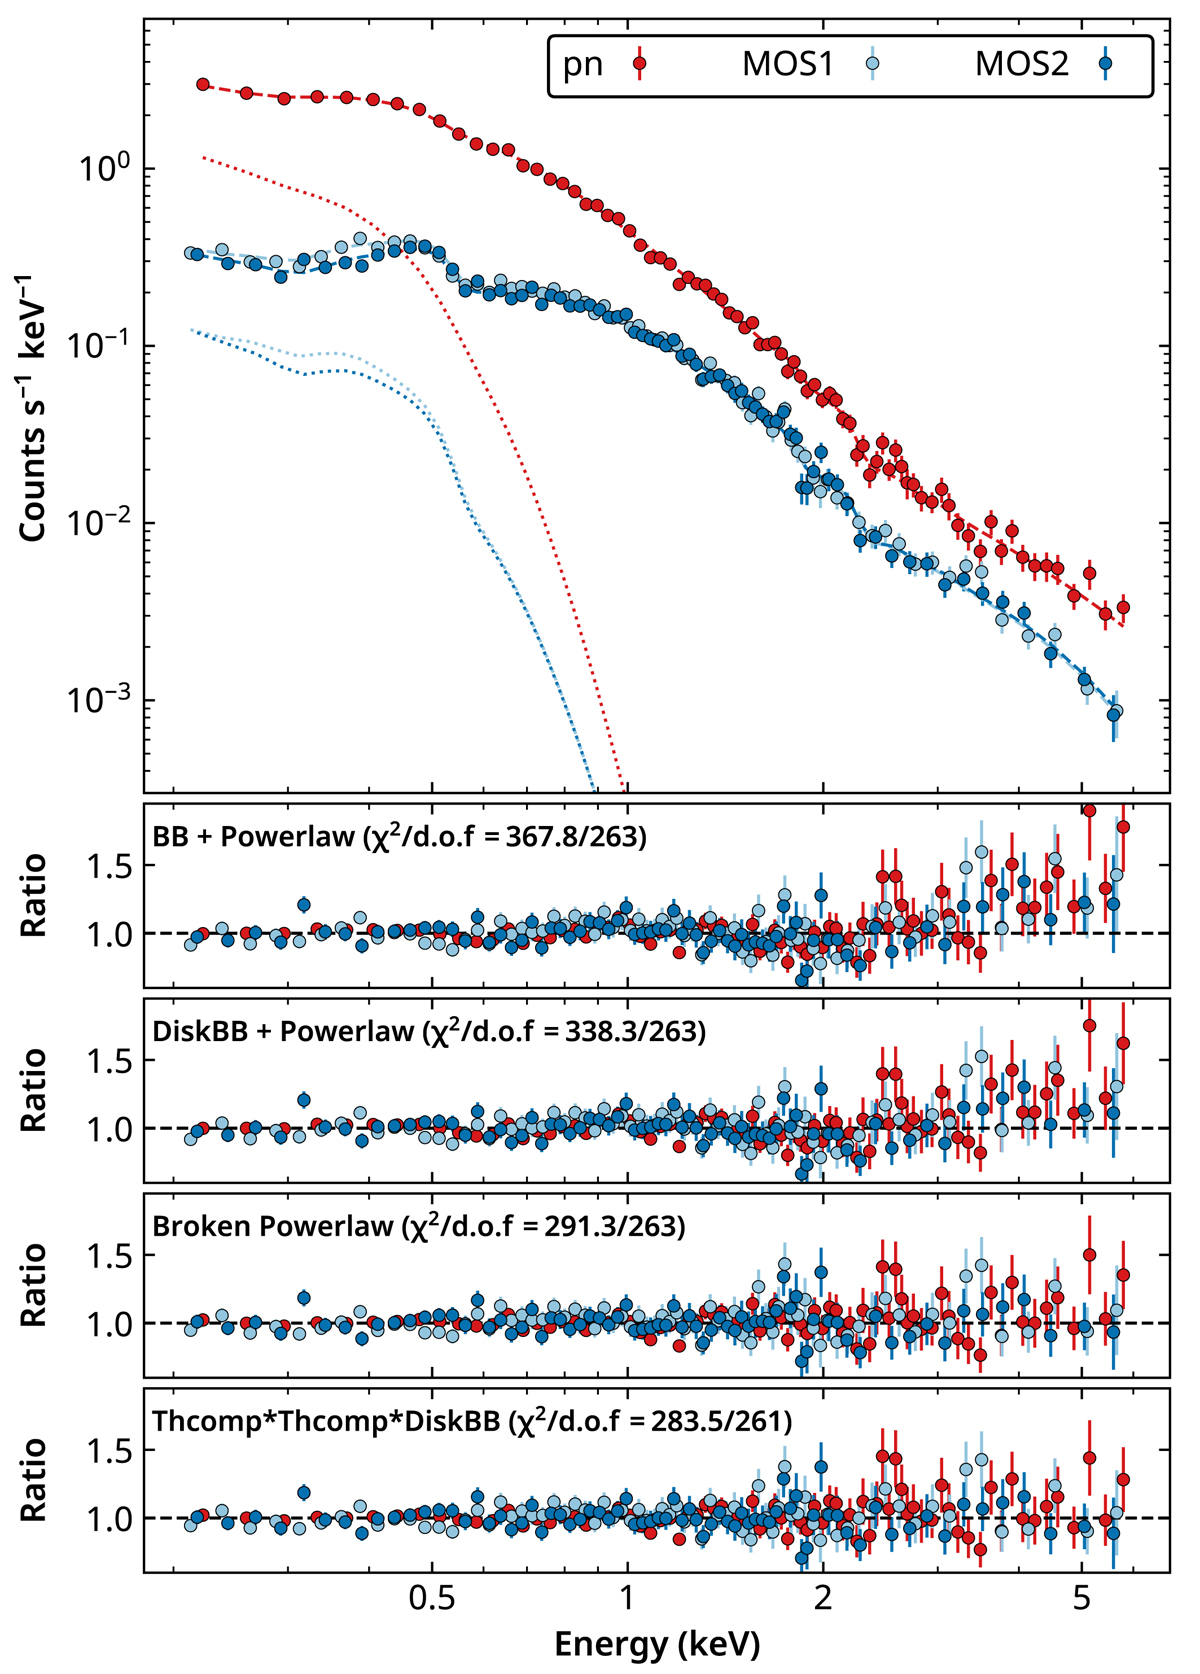
Download original image
X-ray spectral modelling. Upper panel: X-ray spectra of J0456−20 using the data from X2, with EPIC/pn shown in red, EPIC/MOS1 in dark blue, and EPIC/MOS2 in light blue. The best-fitting Comptonisation model (Mcomp) is shown as dashed lines, and the dotted lines represent the diskbb component in the Mcomp model. Bottom panels: Data/model ratio for the Mpbb, Mpdb, Mbkp, and Mcomp models (from top to bottom).
Current usage metrics show cumulative count of Article Views (full-text article views including HTML views, PDF and ePub downloads, according to the available data) and Abstracts Views on Vision4Press platform.
Data correspond to usage on the plateform after 2015. The current usage metrics is available 48-96 hours after online publication and is updated daily on week days.
Initial download of the metrics may take a while.