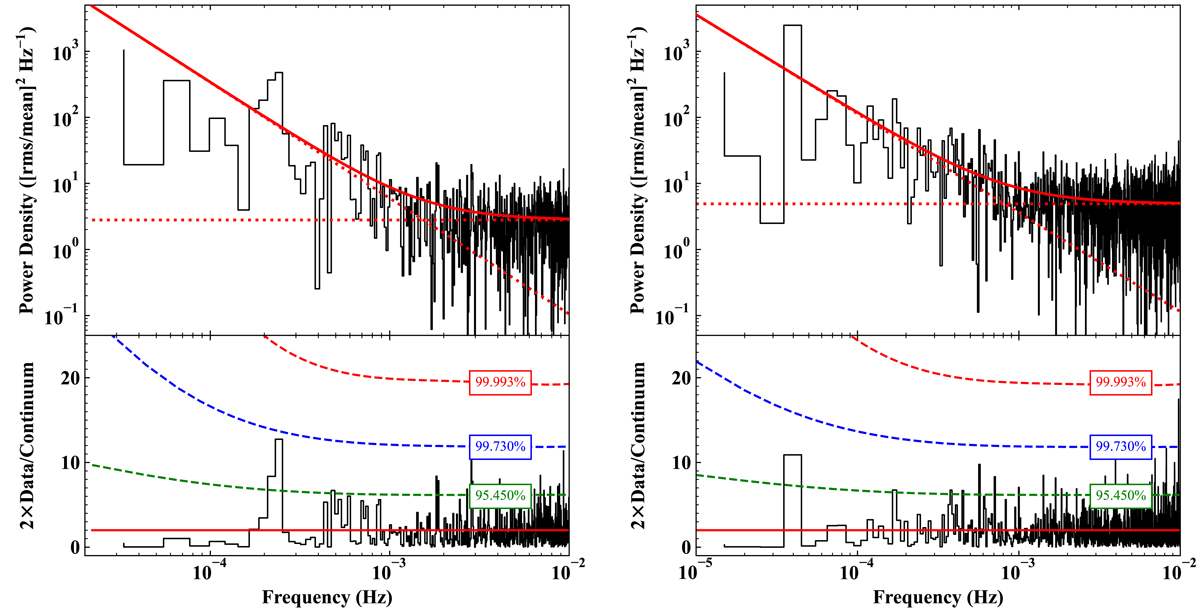
Fig. 5.
Download original image
PSDs for X2 and X3. Left panel: PSD calculated using the pn light curve of X2 in the 0.3 − 0.8 keV energy range with time bin-size of 50 s (upper panel). The solid red line indicates the best-fitting power-law plus Poisson constant model. The dotted red line shows the power-law component. The bottom panel shows the ratio of the data to the model multiplied by 2. This ratio roughly indicates the significance of the deviation of the observed power from the model continuum at a given frequency. The 2, 3, and 4σ confidence levels are marked with dashed green, blue, and red lines, respectively. Right panel: Same as the left panel, but for X3. A peak at a frequency of 2.5 × 10⁻⁴ Hz is seen in the PSD of X2 with a significance of ∼2.9σ.
Current usage metrics show cumulative count of Article Views (full-text article views including HTML views, PDF and ePub downloads, according to the available data) and Abstracts Views on Vision4Press platform.
Data correspond to usage on the plateform after 2015. The current usage metrics is available 48-96 hours after online publication and is updated daily on week days.
Initial download of the metrics may take a while.