Fig. 4.
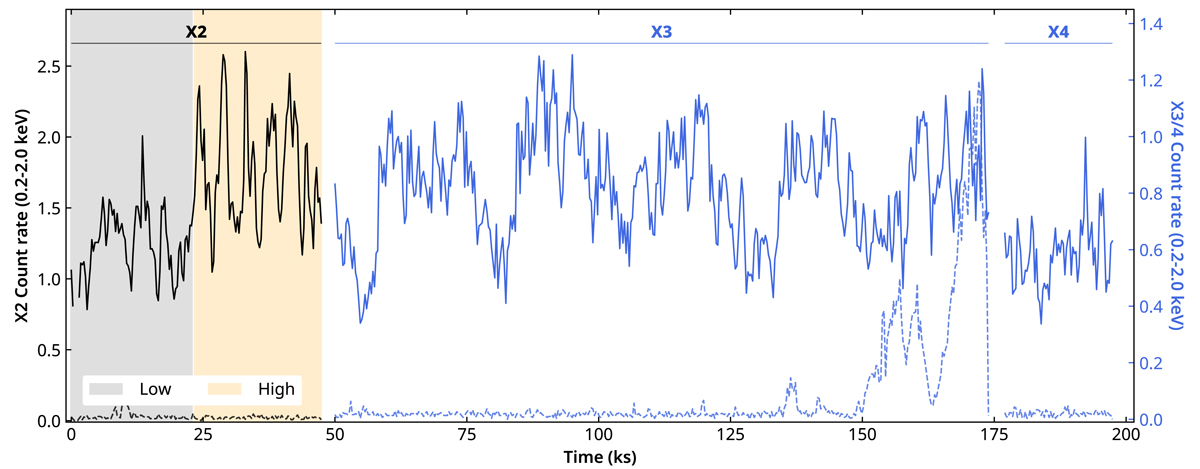
Download original image
XMM-Newton pn light curve in the 0.2 − 2.0 keV energy range, with a bin size of 300 s. The solid and dotted lines show the source and background light curves, respectively. The light curves for X2 are shown in black, and the blue lines show the light curves for X3 and X4. The high-background flare in the last 27 ks of X3 is clearly visible. This high-background period is excluded from our temporal and spectral analysis. The time intervals we used to extract the X-ray spectra in the high- and low-flux state of X2 are marked in orange and grey, respectively.
Current usage metrics show cumulative count of Article Views (full-text article views including HTML views, PDF and ePub downloads, according to the available data) and Abstracts Views on Vision4Press platform.
Data correspond to usage on the plateform after 2015. The current usage metrics is available 48-96 hours after online publication and is updated daily on week days.
Initial download of the metrics may take a while.