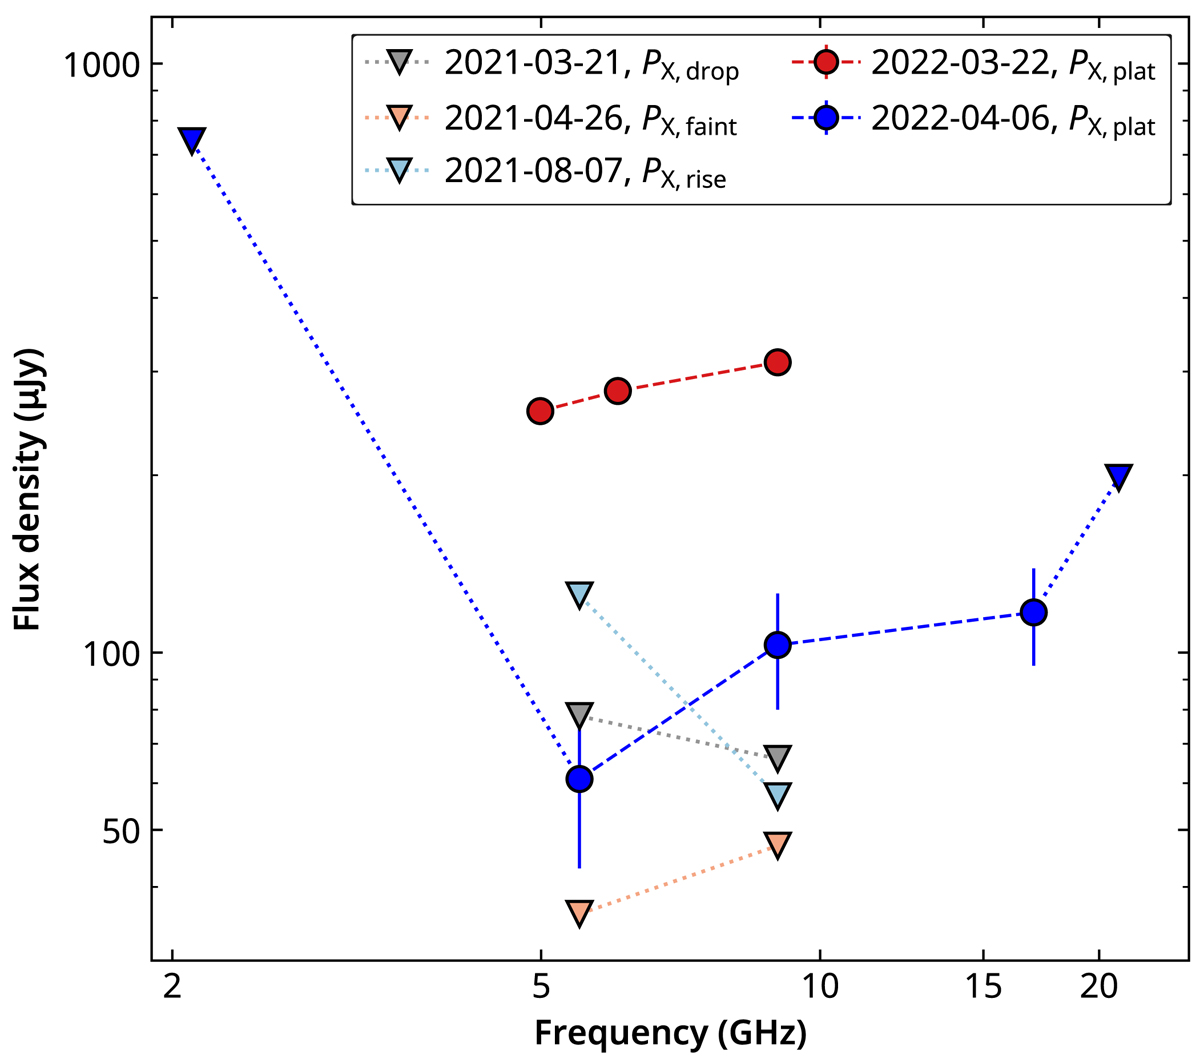
Fig. 3.
Download original image
ATCA radio observations of J0456−20. Filled circles with error bars (1σ uncertainties) represent the observed radio flux densities at different frequencies. Downward triangles indicate the 3σ upper limits. J0456−20 is detected only in the PX, plat phase (blue and red).
Current usage metrics show cumulative count of Article Views (full-text article views including HTML views, PDF and ePub downloads, according to the available data) and Abstracts Views on Vision4Press platform.
Data correspond to usage on the plateform after 2015. The current usage metrics is available 48-96 hours after online publication and is updated daily on week days.
Initial download of the metrics may take a while.