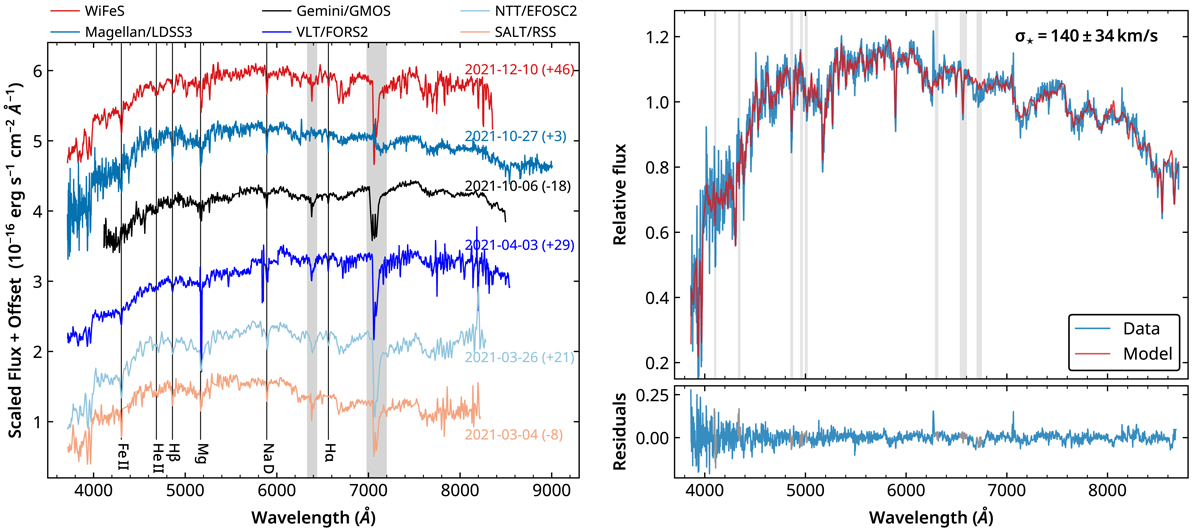
Fig. 2.
Download original image
Optical spectroscopic observations of J0456−20 and stellar velocity measurement. Left panel: The optical spectra are rescaled and shifted for illustration purposes. The values quoted in parentheses are the offset between the date of the optical observation and the date of the closest rapid X-ray flux drop, in units of days. The Magellan LDSS3-C spectrum is corrected for telluric absorption. Right panel: Magellan LDSS3-C rest-frame spectrum is shown with a solid dark blue line, and the solid red line shows the best-fitting model using the pPXF package. The blue lines at the bottom are the fit residuals, and the grey points and shadows mark the regions that are excluded from the fitting. We measured an intrinsic velocity dispersion of 140 ± 34 km s−1 from the Magellan data. We also measured the intrinsic velocity dispersion using the WiFeS data, which have a higher resolution than the Magellan LDSS3-C data. The intrinsic velocity dispersion obtained from the WiFeS data is 120 ± 20 km s−1, which is consistent with that from the Magellan data (see Sect. 3.4.1).
Current usage metrics show cumulative count of Article Views (full-text article views including HTML views, PDF and ePub downloads, according to the available data) and Abstracts Views on Vision4Press platform.
Data correspond to usage on the plateform after 2015. The current usage metrics is available 48-96 hours after online publication and is updated daily on week days.
Initial download of the metrics may take a while.