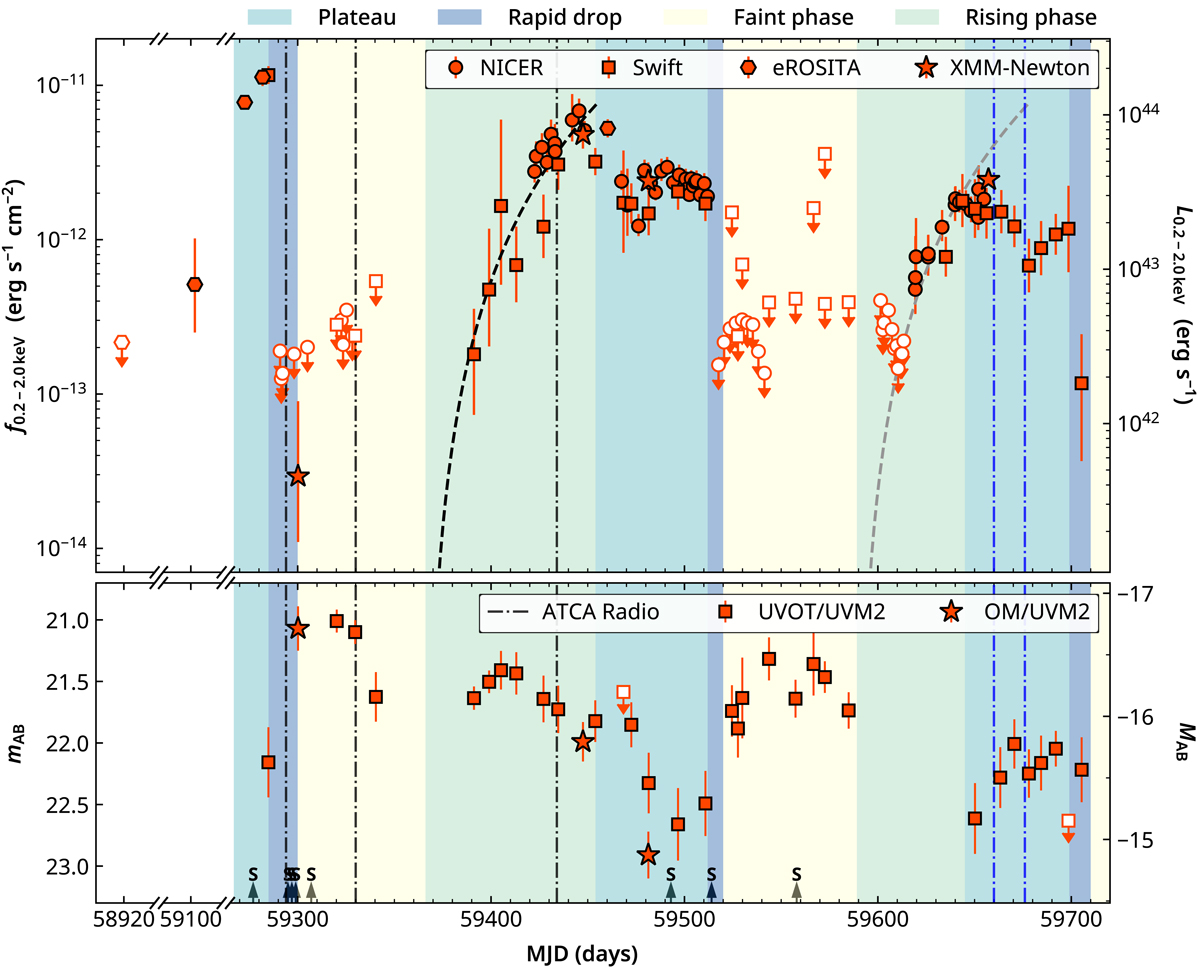
Fig. 1.
Download original image
Long-term X-ray and UV light curves for J0456−20. The coloured regions represent the four phases defined in Sect. 3.1 based on the X-ray light curve: the plateau phase (PX, plat, light cyan), the rapid drop phase (PX, drop, light blue), the faint phase (PX, faint, light yellow), and the rising phase (PX, rise, light green). Upper panel: Red points are the unabsorbed intrinsic 0.2 − 2.0 keV X-ray light curve from eROSITA (hexagons), Swift/XRT (squares), NICER (circles), and XMM-Newton (stars). The error bars indicate 90% uncertainties. The 3σ flux and luminosity upper limits are shown with downward arrows. The dashed black line shows the best-fitting power-law model, frs(t) ∝ (t − t0)β, where t0 = 59377 ± 9 and β = 2.3 ± 0.7 (quoted uncertainties are at 1σ confidence level), during the rise phase. The dashed grey line shows the same model, but shifted by 223 days. Bottom panel: Long-term UV light curves from Swift/UVOT UVM2 (red squares) and XMM-Newton/OM UVM2 (red stars). The error bars mark the 1σ uncertainties. Empty squares with downward arrows indicate 3σ upper limits. The vertical dashed-dotted lines mark the dates of the five ATCA radio observations (black: non-detections; blue: detections), and the upward arrows marked with an S indicate the dates when optical spectra were obtained.
Current usage metrics show cumulative count of Article Views (full-text article views including HTML views, PDF and ePub downloads, according to the available data) and Abstracts Views on Vision4Press platform.
Data correspond to usage on the plateform after 2015. The current usage metrics is available 48-96 hours after online publication and is updated daily on week days.
Initial download of the metrics may take a while.