Open Access
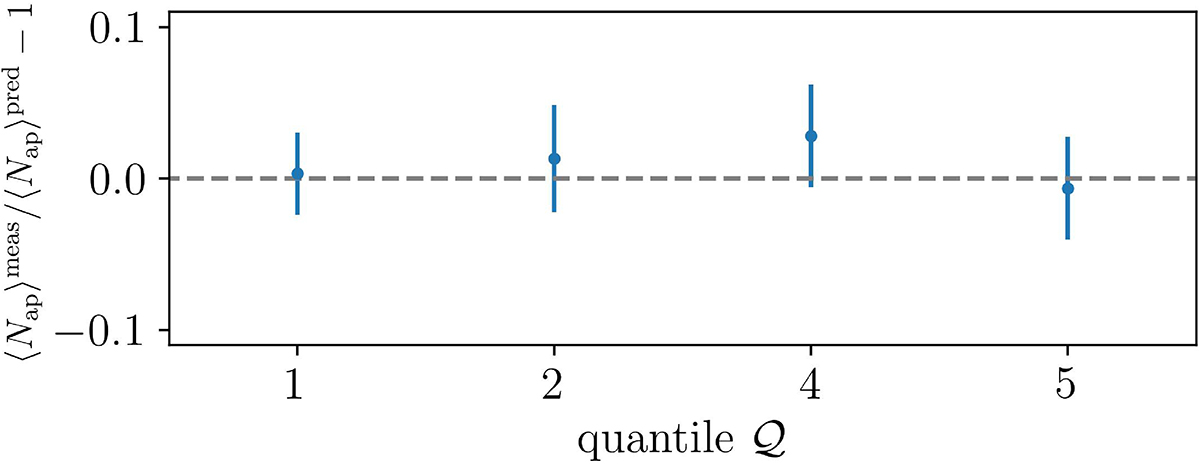
Fig. 8.
Download original image
Relative difference between the mean ⟨Nap⟩ to compare measurements from the KiDS-bright sample and our model, evaluated at the MAP values shown in Table 3. The measured ⟨Nap⟩ are all greater than the predicted ⟨Nap⟩ at MAP just indicating that the measured p(Nap) is broader than the predicted one.
Current usage metrics show cumulative count of Article Views (full-text article views including HTML views, PDF and ePub downloads, according to the available data) and Abstracts Views on Vision4Press platform.
Data correspond to usage on the plateform after 2015. The current usage metrics is available 48-96 hours after online publication and is updated daily on week days.
Initial download of the metrics may take a while.