Fig. A.6.
Download original image
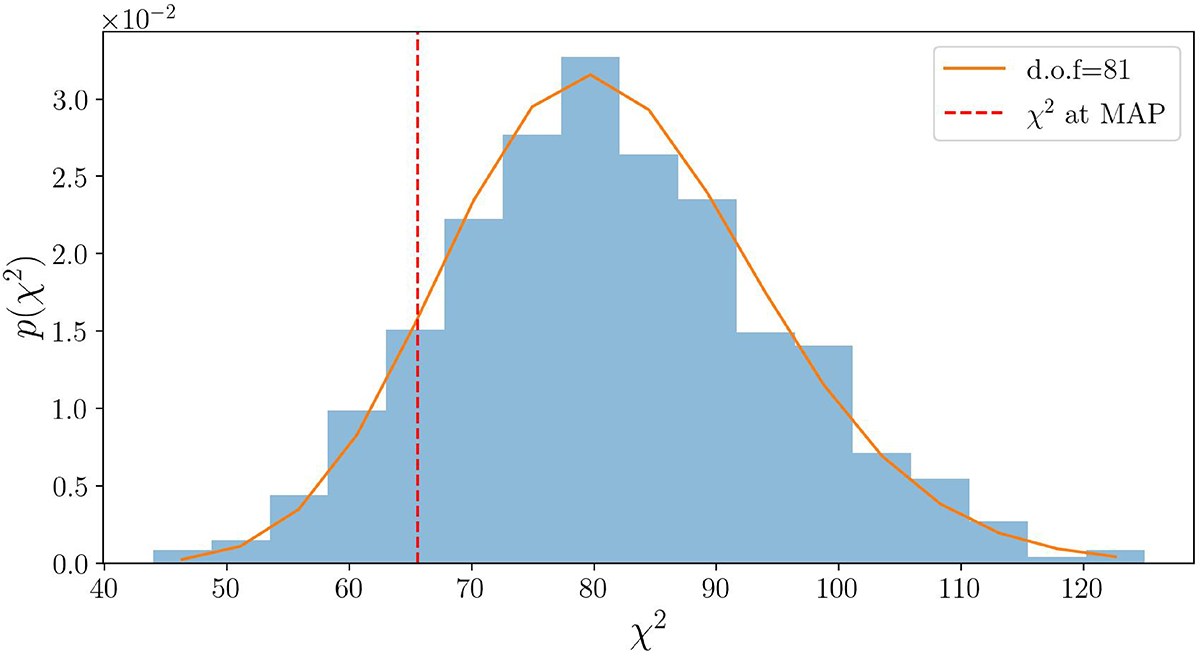
Distribution of χ2 values of mock data vectors that follow from multivariate Gaussian distributions, where the mean is the model prediction at MAP and the covariance is the corresponding covariance for that particular model. The red line shows the χ2 values using the real data vector. The orange line is a χ2 distribution with d.o.f. = 81, which is slightly smaller than the 84 elements of the data vector.
Current usage metrics show cumulative count of Article Views (full-text article views including HTML views, PDF and ePub downloads, according to the available data) and Abstracts Views on Vision4Press platform.
Data correspond to usage on the plateform after 2015. The current usage metrics is available 48-96 hours after online publication and is updated daily on week days.
Initial download of the metrics may take a while.