Open Access
Fig. A.2.
Download original image
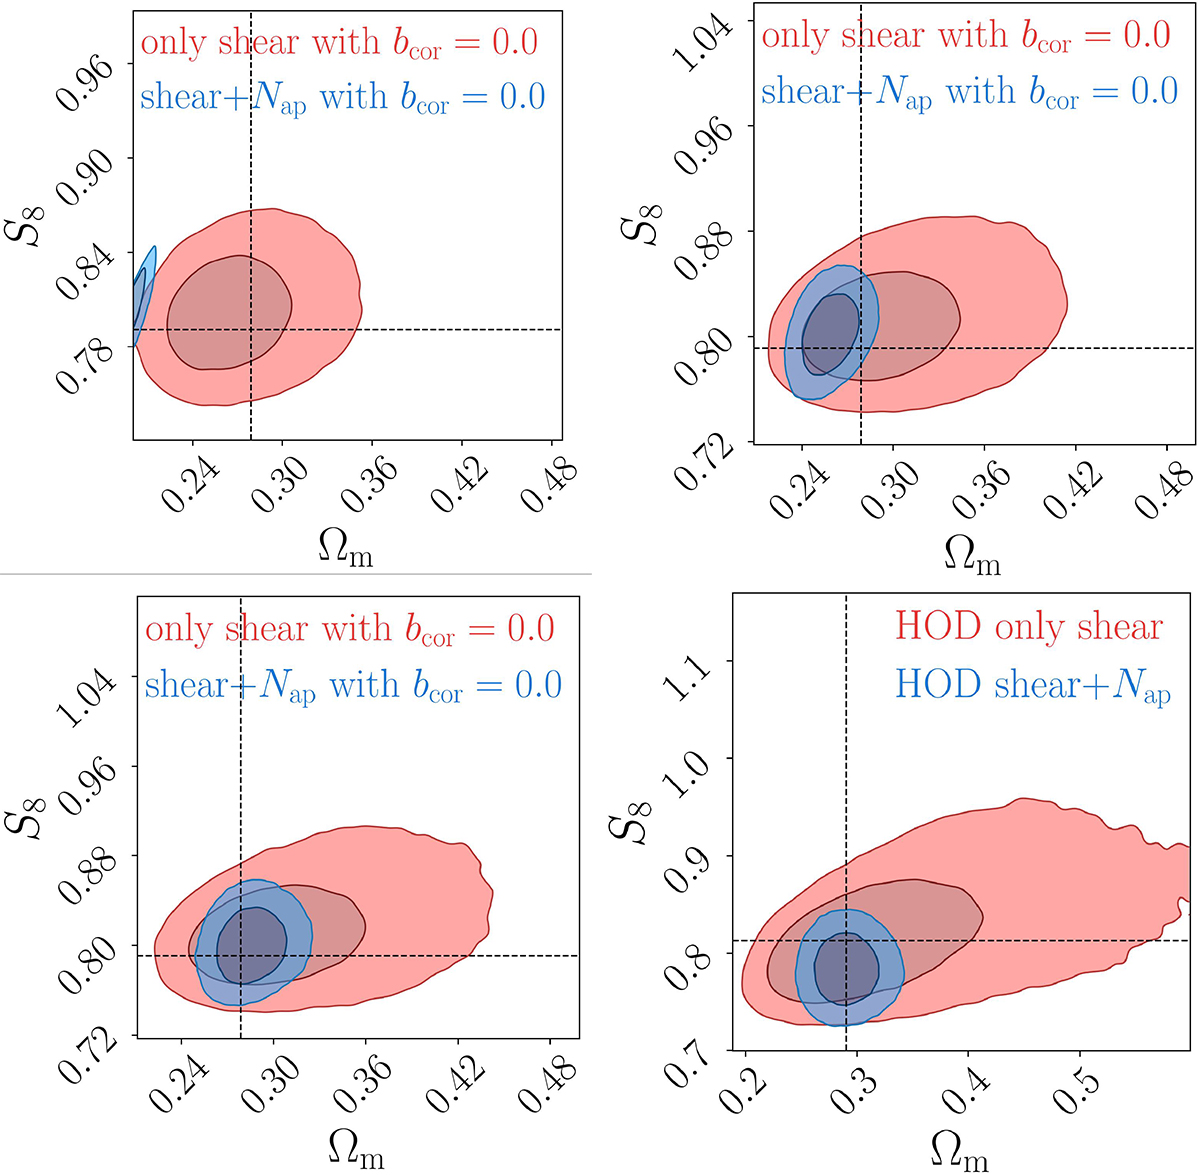
Posterior distributions, using different b2 values to distribute galaxies to the same density contrast, from which a data vector is measured. The lower right panel shows the posterior results from simulations, where galaxies are distributed with a HOD. The model vector uses for all four cases a linear galaxy bias model.
Current usage metrics show cumulative count of Article Views (full-text article views including HTML views, PDF and ePub downloads, according to the available data) and Abstracts Views on Vision4Press platform.
Data correspond to usage on the plateform after 2015. The current usage metrics is available 48-96 hours after online publication and is updated daily on week days.
Initial download of the metrics may take a while.