Fig. 12.
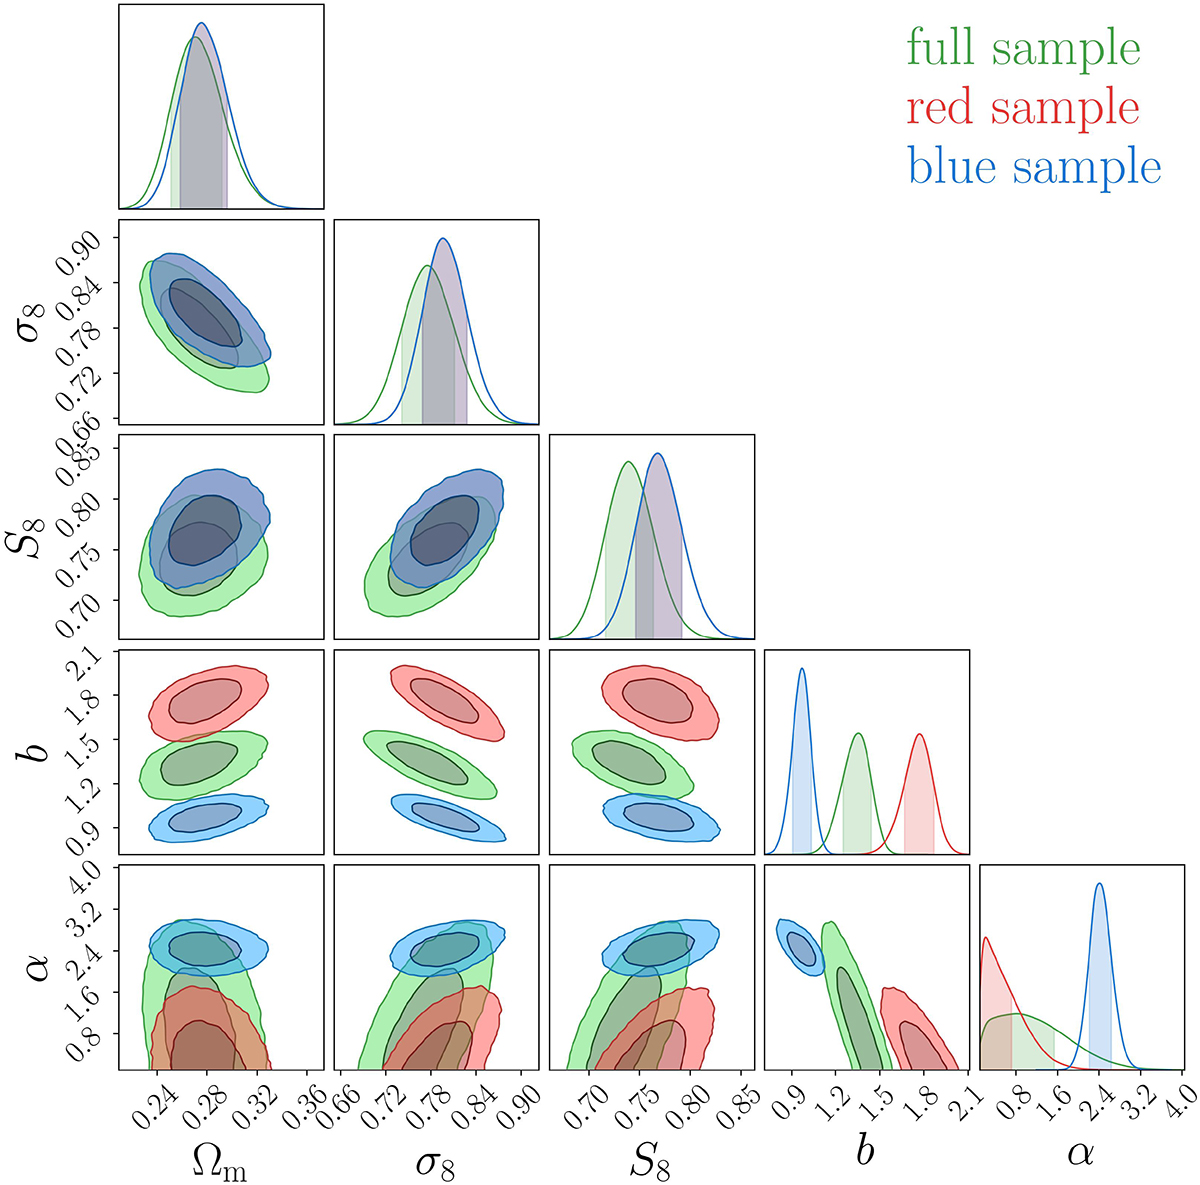
Download original image
Posterior for the full KiDS-bright sample shown in green, while the joint red+blue posteriors represent the results of the colour-selected samples. In the latter case, the red and blue samples share the same cosmology (the dark blue contours) by construction. The resulting measured and best-fit predicted shear profiles for the red and blue samples are displayed in Fig. B.2 and the corresponding mean aperture number values are seen in Fig. B.3.
Current usage metrics show cumulative count of Article Views (full-text article views including HTML views, PDF and ePub downloads, according to the available data) and Abstracts Views on Vision4Press platform.
Data correspond to usage on the plateform after 2015. The current usage metrics is available 48-96 hours after online publication and is updated daily on week days.
Initial download of the metrics may take a while.