Fig. 1.
Download original image
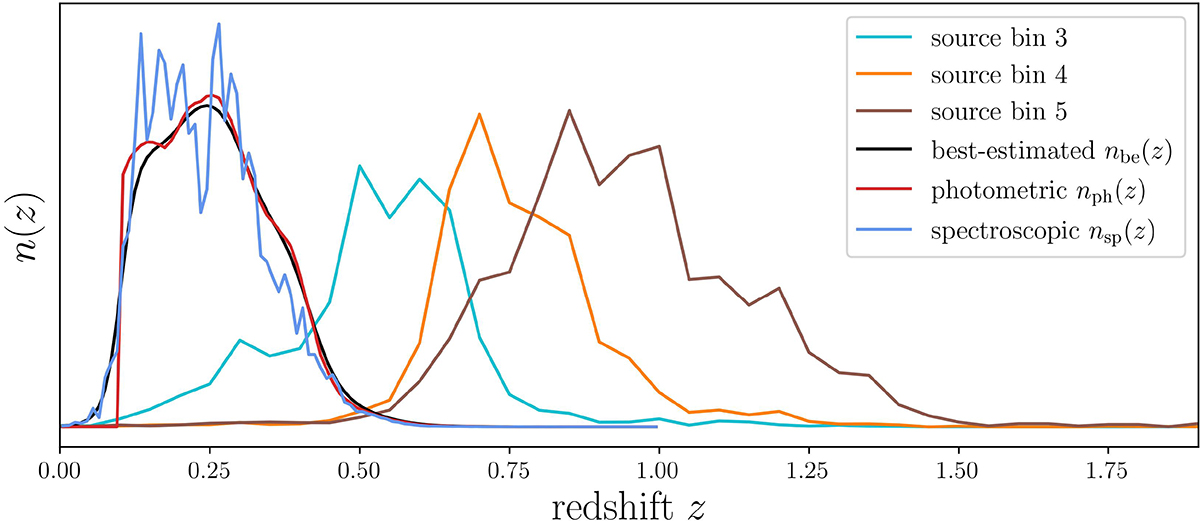
Redshift distributions, n(z), of the galaxy samples. The lens sample is obtained from the KiDS-bright galaxies described in Bi21. The blue line shows nsp(z), i.e. the redshift distribution of KiDS galaxies for which we have spectra from the GAMA survey. The red line shows nph(z), the distribution of the full KiDS-bright sample as estimated by ANNz2 with a photometric redshift cut of zph < 0.1. The black line shows our best-estimated nbe(z): a smoothed version of nph(z) that better accounts for photometric redshift errors. The cyan, orange, and brown lines show the third, fourth and fifth redshift bins of the KiDS-1000 data, as estimated in H21. As the third bin strongly overlaps the sources, it is excluded from the analysis.
Current usage metrics show cumulative count of Article Views (full-text article views including HTML views, PDF and ePub downloads, according to the available data) and Abstracts Views on Vision4Press platform.
Data correspond to usage on the plateform after 2015. The current usage metrics is available 48-96 hours after online publication and is updated daily on week days.
Initial download of the metrics may take a while.