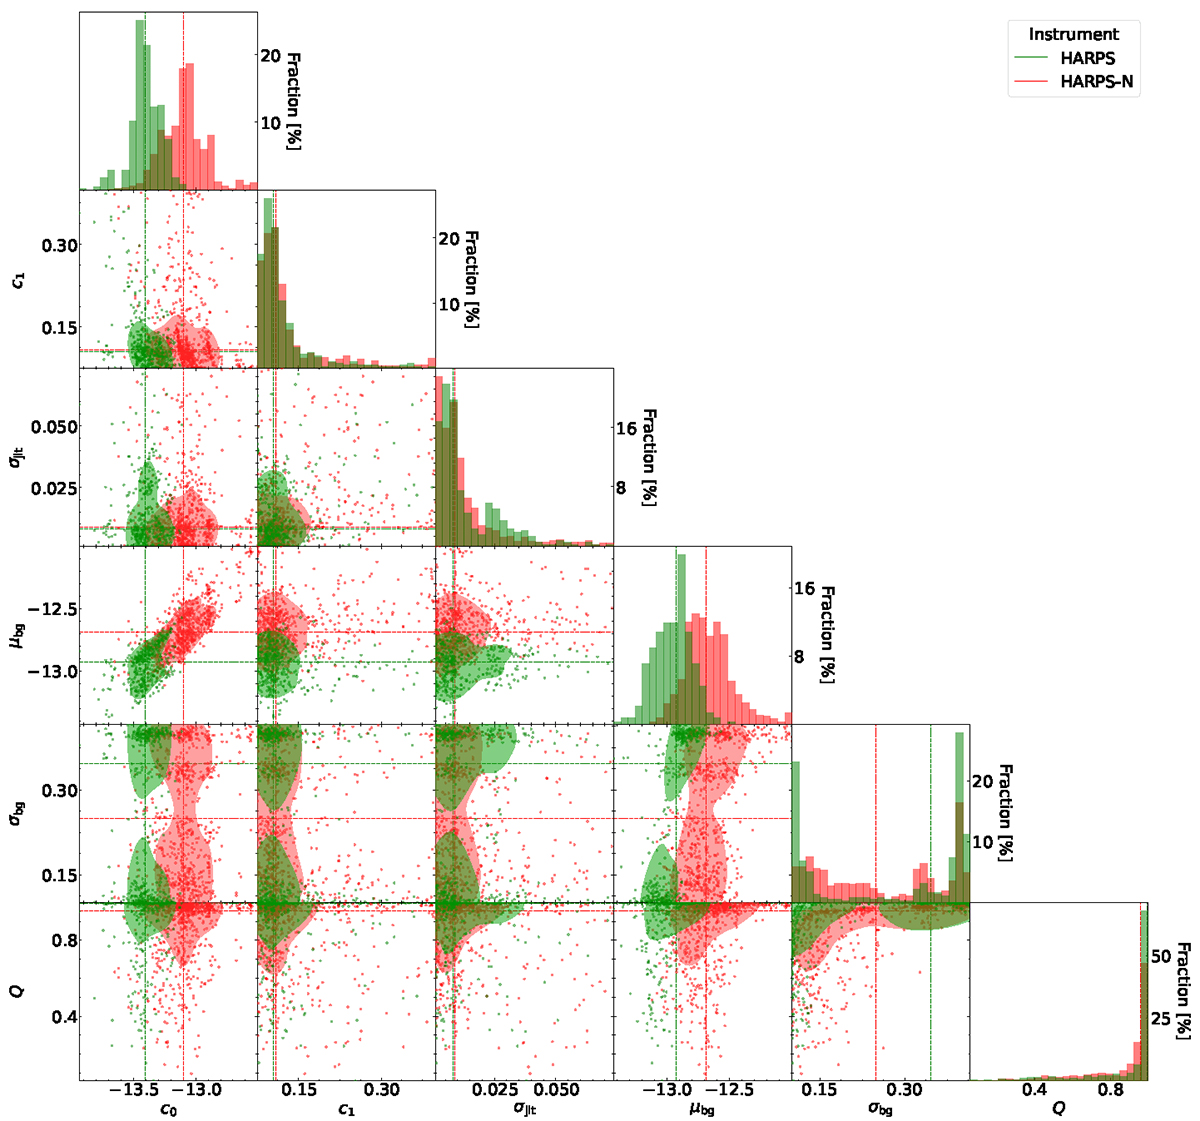
Fig. A.1.
Download original image
Corner plot of MCMC parameters. The subplots show the distribution of the daily fitted parameters described in Table 1, for both HARPS (green points) and HARPS-N (red points). The top subplot of each column shows the histogram in units of fraction of the total number of days per instrument. The dashed lines indicate the median values, and the contour curves represent the ±1σ kernel densities.
Current usage metrics show cumulative count of Article Views (full-text article views including HTML views, PDF and ePub downloads, according to the available data) and Abstracts Views on Vision4Press platform.
Data correspond to usage on the plateform after 2015. The current usage metrics is available 48-96 hours after online publication and is updated daily on week days.
Initial download of the metrics may take a while.