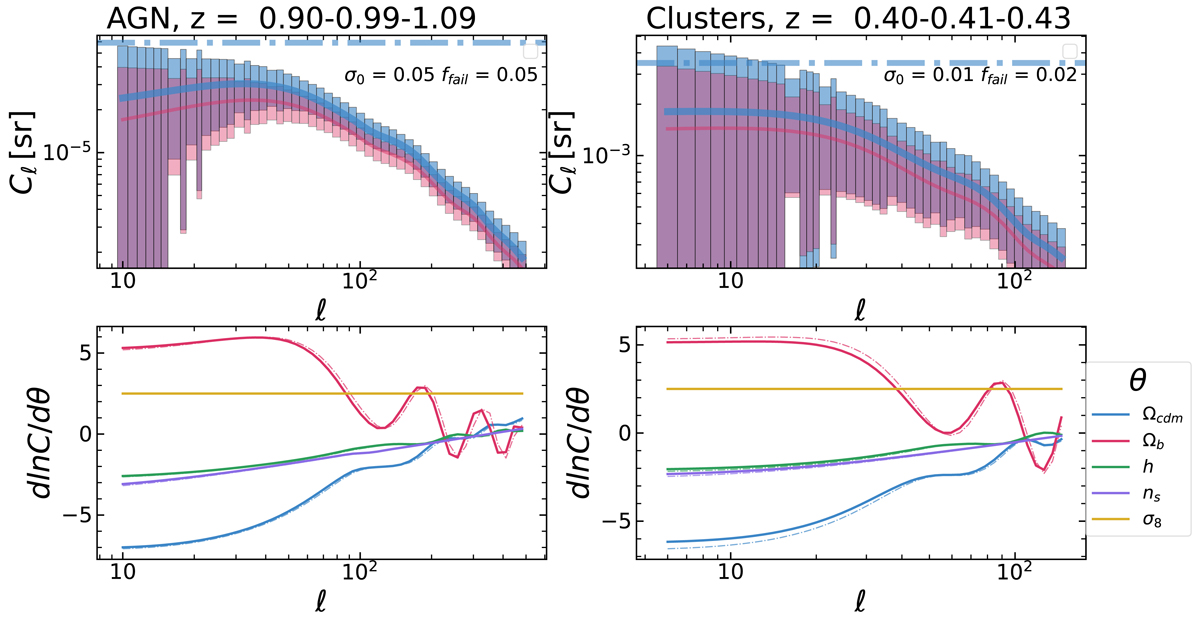
Fig. 4.
Download original image
Example of angular power spectra of AGNs (left panels) and clusters (right panels). In the top panels, the auto-spectrum of the first redshift bin is shown in blue (bin 0.9 < z < 0.99 for AGNs and 0.40 < z < 0.41 for clusters), and the cross-spectra of the first redshift bin with the second bin (0.99 < z < 1.09 for AGNs and 0.41 < z < 0.43 for clusters) in red. Horizontal lines show the level of Poisson noise for auto-spectra. In the bottom panels, the derivatives of those power spectra (solid and dashed lines, respectively) are shown with respect to parameters in the plot’s legend. Parameters of photometric redshift errors are σ0 = 0.05 and 0.01, ffail = 0.05 and 0.02 for AGNs and clusters, respectively.
Current usage metrics show cumulative count of Article Views (full-text article views including HTML views, PDF and ePub downloads, according to the available data) and Abstracts Views on Vision4Press platform.
Data correspond to usage on the plateform after 2015. The current usage metrics is available 48-96 hours after online publication and is updated daily on week days.
Initial download of the metrics may take a while.