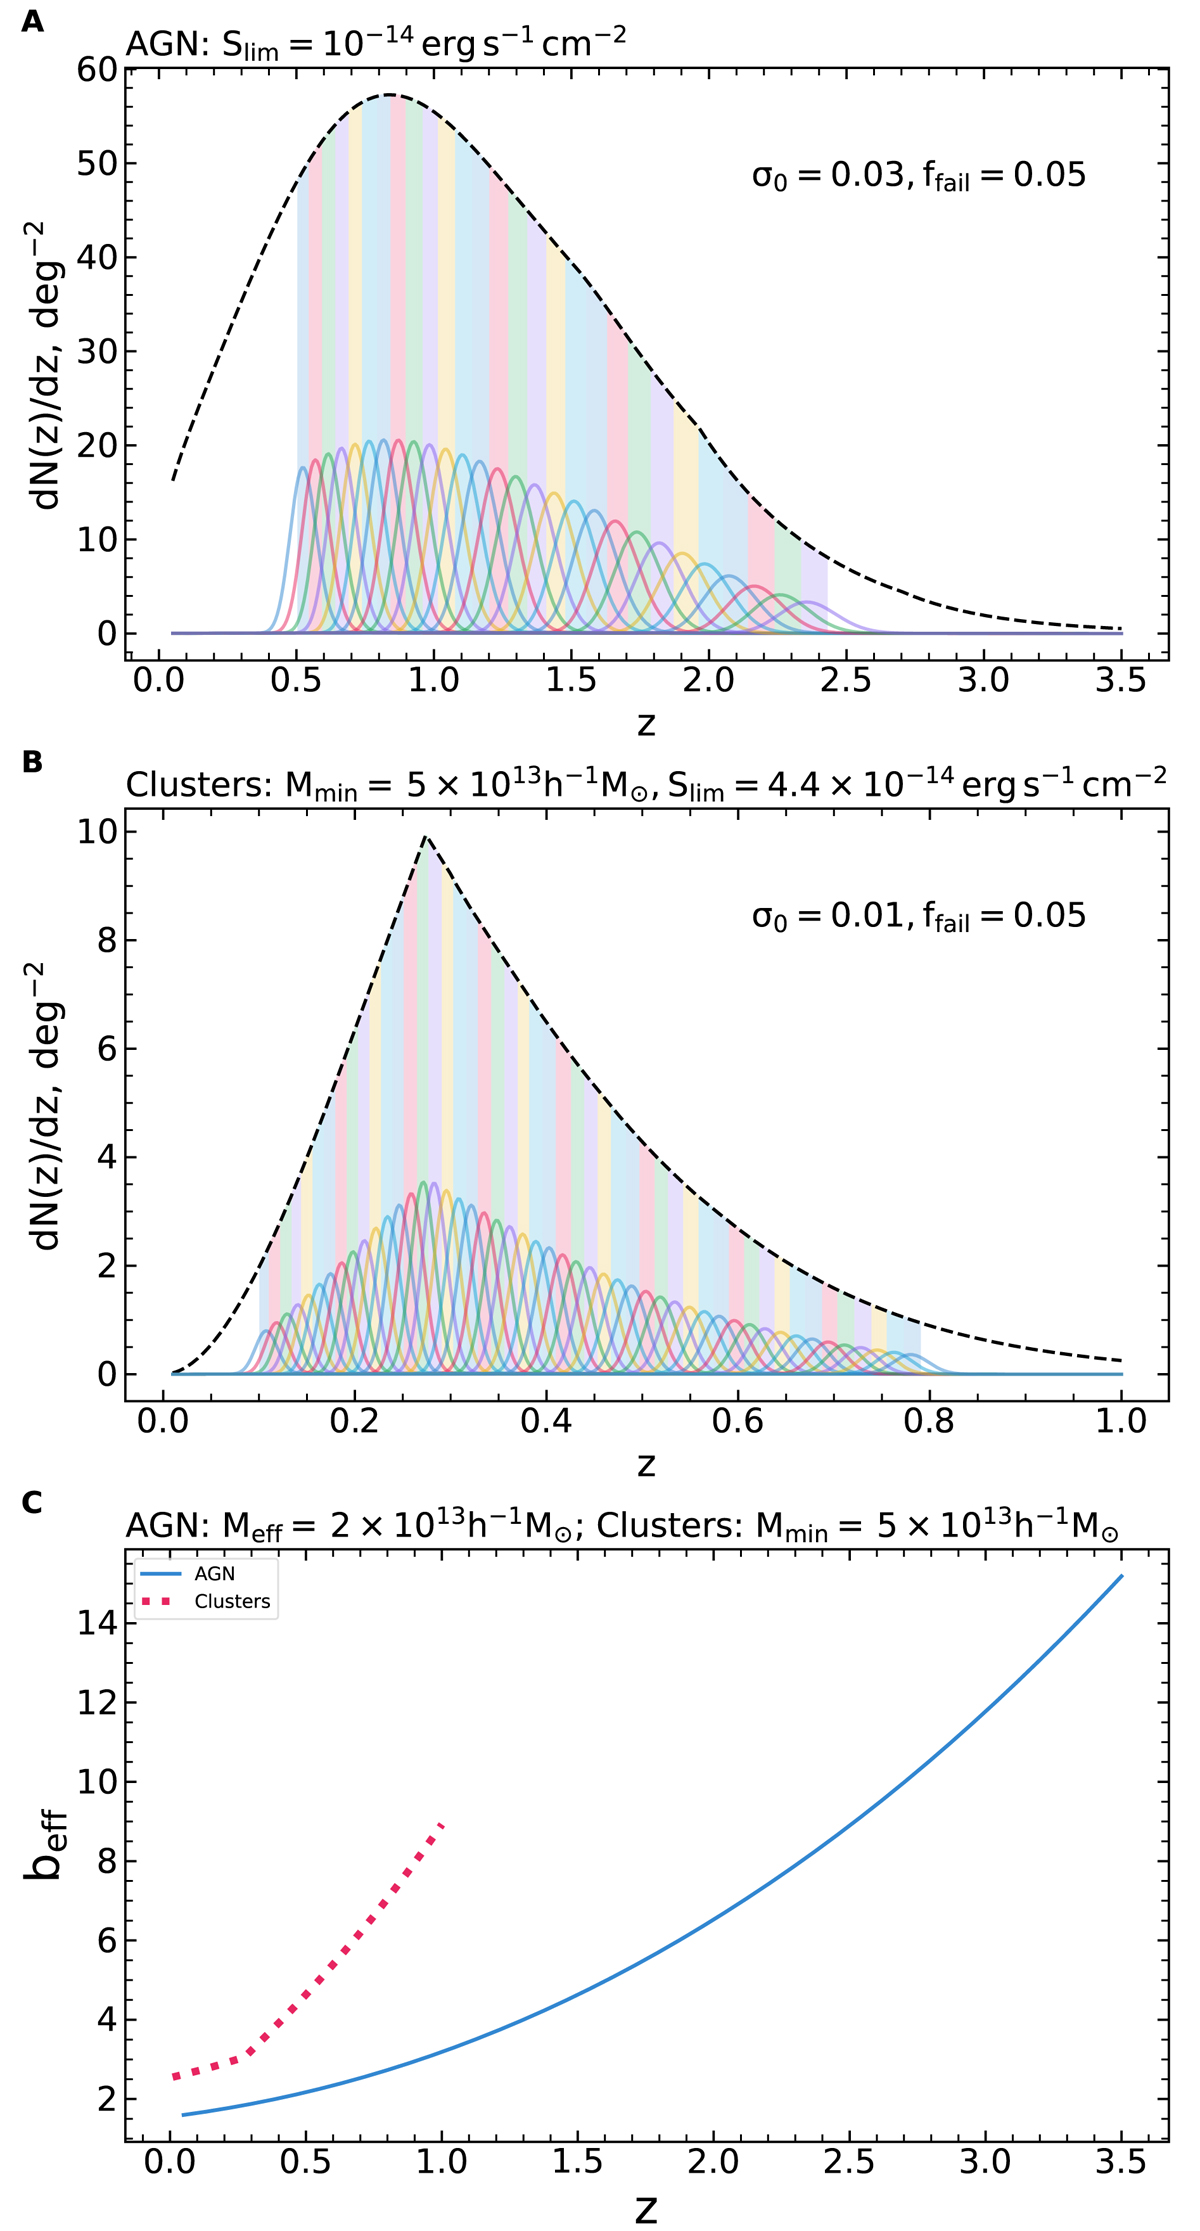
Fig. 2.
Download original image
Panels a, b: redshift distributions of AGN and cluster tracers. The black dashed line in each panel shows the total distribution of objects, while solid lines show the distributions of objects in photo-z bins (the corresponding vertical stripes show the boundaries of the bins in the photo-z space). The parameters for the photometric redshift scatter are shown in each panel. Panel c: effective linear bias factors of tracer populations as a function of z.
Current usage metrics show cumulative count of Article Views (full-text article views including HTML views, PDF and ePub downloads, according to the available data) and Abstracts Views on Vision4Press platform.
Data correspond to usage on the plateform after 2015. The current usage metrics is available 48-96 hours after online publication and is updated daily on week days.
Initial download of the metrics may take a while.