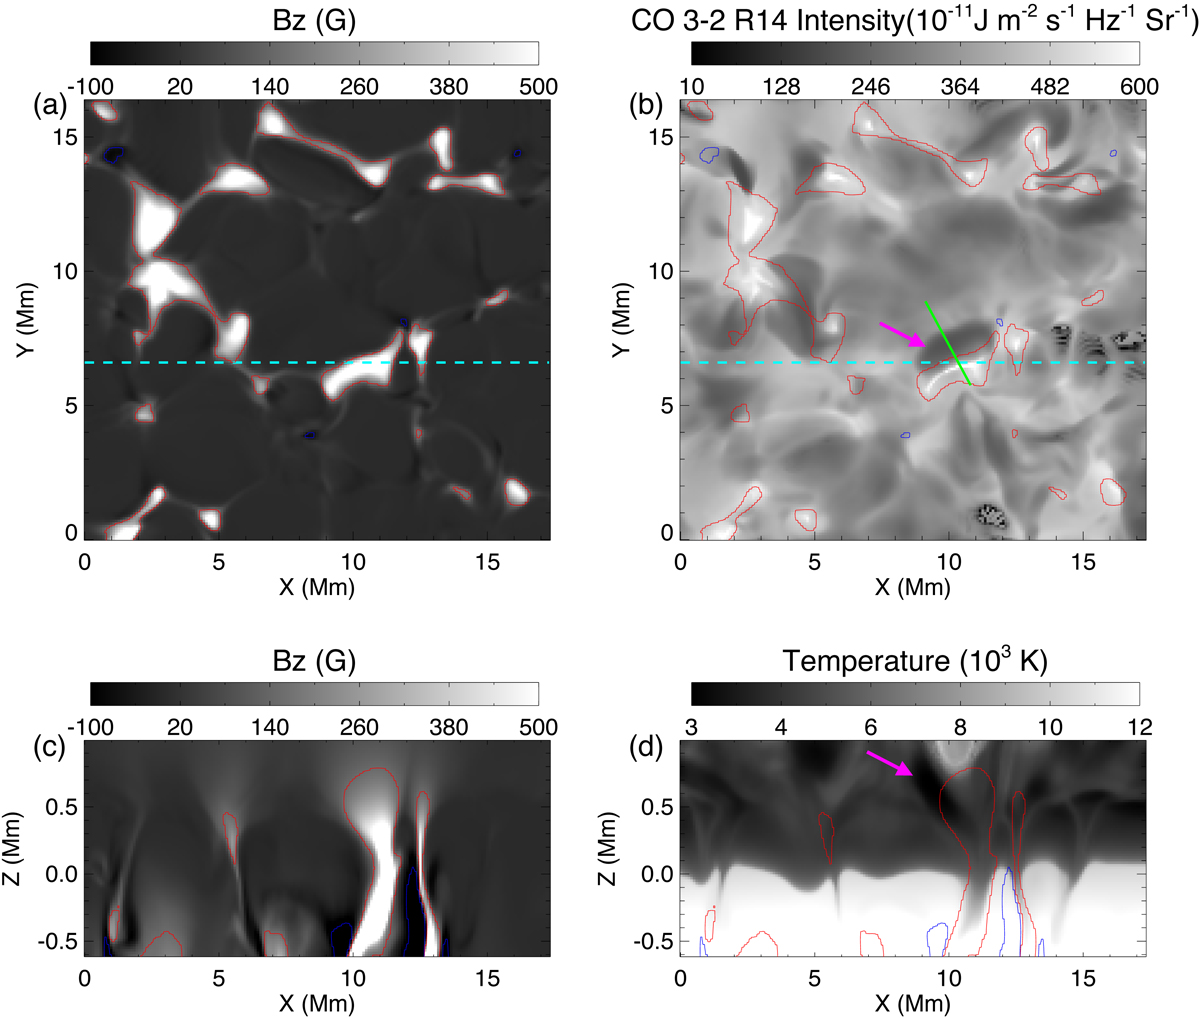
Fig. 6.
Download original image
Radiation MHD simulation results of network magnetic field region with Bifrost code. Panels a and b show the vertical component of the magnetic field (Bz) and synthetic CO 3–2 R14 line center intensity map. Panels c and d show the strength of Bz and temperature on the slice indicated by the dashed cyan lines in panels a and b. The red and blue contours indicate the positive and negative magnetic fields with 150 G and −50 G, respectively. The magenta arrow in panel b indicates a typical cold bubble from the CO 3–2 R14 line center intensity map, which is located near the edge of the magnetic network. Correspondingly, the temperature of the bubble regions at the height of 500 km is lower than the other regions (magenta arrow in panel d). The green line in panel b indicates the slit showing the relationship of CO 3–2 R14 line center intensity and Bz strength arranged in Fig. 8b.
Current usage metrics show cumulative count of Article Views (full-text article views including HTML views, PDF and ePub downloads, according to the available data) and Abstracts Views on Vision4Press platform.
Data correspond to usage on the plateform after 2015. The current usage metrics is available 48-96 hours after online publication and is updated daily on week days.
Initial download of the metrics may take a while.